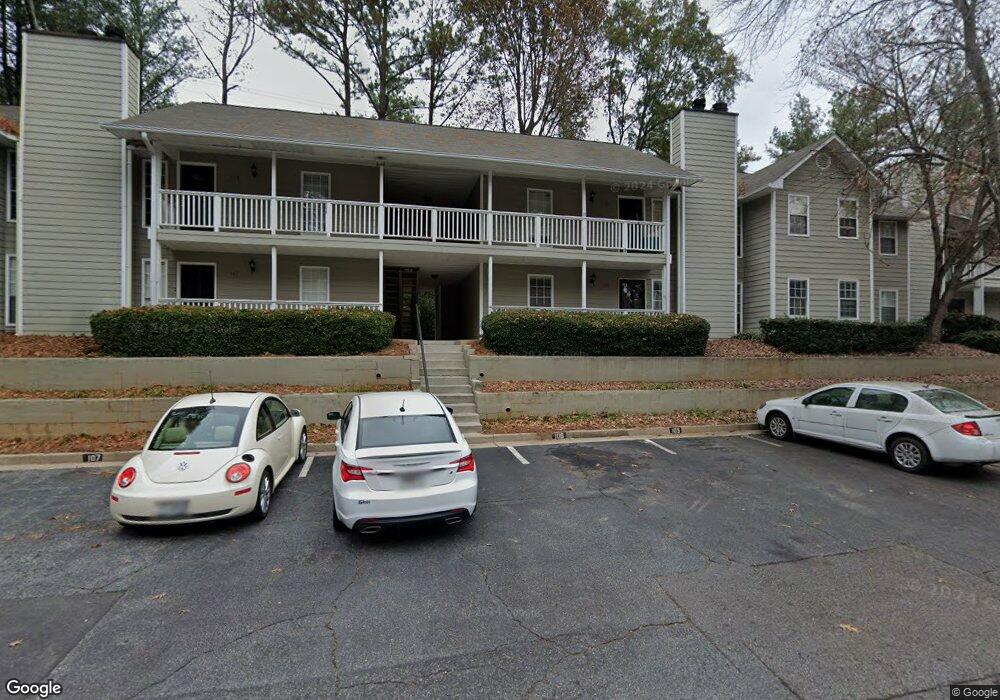
106 Sterling Ct Unit 106 Alpharetta, GA 30004
Estimated Value: $161,000 - $249,729
2
Beds
2
Baths
1,250
Sq Ft
$153/Sq Ft
Est. Value
About This Home
This home is located at 106 Sterling Ct Unit 106, Alpharetta, GA 30004 and is currently estimated at $190,932, approximately $152 per square foot. 106 Sterling Ct Unit 106 is a home located in Fulton County with nearby schools including Manning Oaks Elementary School, Hopewell Middle School, and Alpharetta High School.
Ownership History
Date
Name
Owned For
Owner Type
Purchase Details
Closed on
Mar 31, 2025
Sold by
Keyglee Atl
Bought by
Vt Associates Llc
Current Estimated Value
Purchase Details
Closed on
Jul 9, 2007
Sold by
Golochtchapova Elena
Bought by
Gillham Robert
Home Financials for this Owner
Home Financials are based on the most recent Mortgage that was taken out on this home.
Original Mortgage
$83,693
Interest Rate
6.52%
Mortgage Type
FHA
Purchase Details
Closed on
Jun 21, 2002
Sold by
Seoville Warren K
Bought by
Golochtchapova Elena
Home Financials for this Owner
Home Financials are based on the most recent Mortgage that was taken out on this home.
Original Mortgage
$78,030
Interest Rate
6.79%
Mortgage Type
New Conventional
Purchase Details
Closed on
Apr 14, 1999
Sold by
Itaipu Invst Co Nv
Bought by
Scoville Warren K
Home Financials for this Owner
Home Financials are based on the most recent Mortgage that was taken out on this home.
Original Mortgage
$59,850
Interest Rate
7.06%
Mortgage Type
New Conventional
Create a Home Valuation Report for This Property
The Home Valuation Report is an in-depth analysis detailing your home's value as well as a comparison with similar homes in the area
Home Values in the Area
Average Home Value in this Area
Purchase History
| Date | Buyer | Sale Price | Title Company |
|---|---|---|---|
| Vt Associates Llc | $159,990 | -- | |
| Gillham Robert | $84,400 | -- | |
| Golochtchapova Elena | $86,700 | -- | |
| Scoville Warren K | $66,500 | -- |
Source: Public Records
Mortgage History
| Date | Status | Borrower | Loan Amount |
|---|---|---|---|
| Previous Owner | Gillham Robert | $85,300 | |
| Previous Owner | Gillham Robert | $83,693 | |
| Previous Owner | Golochtchapova Elena | $78,030 | |
| Previous Owner | Scoville Warren K | $59,850 |
Source: Public Records
Tax History Compared to Growth
Tax History
| Year | Tax Paid | Tax Assessment Tax Assessment Total Assessment is a certain percentage of the fair market value that is determined by local assessors to be the total taxable value of land and additions on the property. | Land | Improvement |
|---|---|---|---|---|
| 2025 | $50 | $68,440 | $9,840 | $58,600 |
| 2023 | $50 | $67,680 | $9,840 | $57,840 |
| 2022 | $661 | $67,680 | $9,840 | $57,840 |
| 2021 | $704 | $65,720 | $9,560 | $56,160 |
| 2020 | $693 | $53,880 | $7,000 | $46,880 |
| 2019 | $49 | $52,920 | $6,880 | $46,040 |
| 2018 | $871 | $42,960 | $5,600 | $37,360 |
| 2017 | $488 | $27,920 | $4,040 | $23,880 |
| 2016 | $486 | $27,920 | $4,040 | $23,880 |
| 2015 | $509 | $27,920 | $4,040 | $23,880 |
| 2014 | $682 | $35,000 | $3,440 | $31,560 |
Source: Public Records
Map
Nearby Homes
- 122 Sterling Ct Unit 122
- 1505 Planters Ridge Ln
- 136 Sterling Ct
- 1630 Homestead Trail
- 1702 Cotton Patch Ln
- 1180 Arborhill Ln
- 1035 Arborhill Ln
- 4020 Lullwater Way
- 7045 Trellis Ct
- 225 Jayne Ellen Way
- 208 Wade Creek Rd
- 1825 Millstone Ct
- 3053 Westwood Way
- 4053 Whitehall Way
- 396 Academy St
- 184 Cold Creek Dr
- 154 Cold Creek Dr
- 2926 Webb Bridge Rd
- 108 Sterling Ct Unit 108
- 107 Sterling Ct
- 105 Sterling Ct
- 104 Sterling Ct
- 103 Sterling Ct
- 112 Sterling Ct
- 102 Sterling Ct
- 102 Sterling Ct Unit 102
- 113 Sterling Ct
- 114 Sterling Ct
- 111 Sterling Ct
- 111 Sterling Ct Unit 111
- 4390 Drive
- 110 Sterling Ct
- 115 Sterling Ct
- 101 Sterling Ct
- 116 Sterling Ct Unit 116
- 109 Sterling Ct
- 2005 Monroe Dr
- 12195 Clairmonte Ave