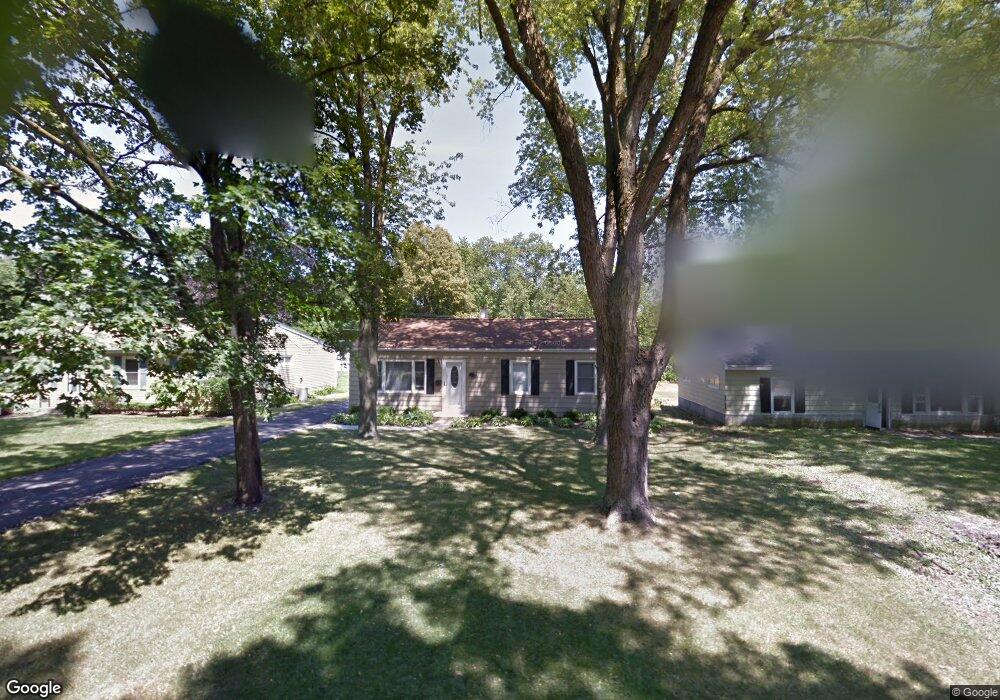
1131 Grant St Wheaton, IL 60189
Southeast Wheaton NeighborhoodEstimated Value: $271,000 - $311,586
3
Beds
1
Bath
980
Sq Ft
$298/Sq Ft
Est. Value
About This Home
This home is located at 1131 Grant St, Wheaton, IL 60189 and is currently estimated at $292,397, approximately $298 per square foot. 1131 Grant St is a home located in DuPage County with nearby schools including Lincoln Elementary School, Edison Middle School, and Wheaton Warrenville South High School.
Ownership History
Date
Name
Owned For
Owner Type
Purchase Details
Closed on
Feb 3, 2009
Sold by
Logan Jonathan T and Logan Elizabeth A
Bought by
Byrne Leslie A
Current Estimated Value
Home Financials for this Owner
Home Financials are based on the most recent Mortgage that was taken out on this home.
Original Mortgage
$73,500
Outstanding Balance
$47,284
Interest Rate
5.03%
Mortgage Type
Purchase Money Mortgage
Estimated Equity
$245,462
Purchase Details
Closed on
Feb 25, 2005
Sold by
Dms Realty Partners Inc
Bought by
Logan Jonathan T and Logan Elizabeth A
Home Financials for this Owner
Home Financials are based on the most recent Mortgage that was taken out on this home.
Original Mortgage
$188,000
Interest Rate
4.87%
Mortgage Type
New Conventional
Purchase Details
Closed on
Aug 27, 2004
Sold by
Flaherty Cheryl
Bought by
Dms Realty Partners Inc
Create a Home Valuation Report for This Property
The Home Valuation Report is an in-depth analysis detailing your home's value as well as a comparison with similar homes in the area
Home Values in the Area
Average Home Value in this Area
Purchase History
| Date | Buyer | Sale Price | Title Company |
|---|---|---|---|
| Byrne Leslie A | $170,000 | First American Title | |
| Logan Jonathan T | $235,000 | Attorneys Title Guaranty Fun | |
| Dms Realty Partners Inc | $155,000 | Pntn |
Source: Public Records
Mortgage History
| Date | Status | Borrower | Loan Amount |
|---|---|---|---|
| Open | Byrne Leslie A | $73,500 | |
| Closed | Byrne Leslie A | $39,100 | |
| Closed | Byrne Leslie A | $20,000 | |
| Closed | Byrne Leslie A | $32,300 | |
| Previous Owner | Logan Jonathan T | $208,000 | |
| Previous Owner | Logan Jonathan T | $52,000 | |
| Previous Owner | Logan Jonathan T | $188,000 | |
| Previous Owner | Flaherty Cheryl | $20,000 | |
| Closed | Logan Jonathan T | $47,000 |
Source: Public Records
Tax History Compared to Growth
Tax History
| Year | Tax Paid | Tax Assessment Tax Assessment Total Assessment is a certain percentage of the fair market value that is determined by local assessors to be the total taxable value of land and additions on the property. | Land | Improvement |
|---|---|---|---|---|
| 2023 | $4,497 | $74,550 | $34,030 | $40,520 |
| 2022 | $4,463 | $70,450 | $32,160 | $38,290 |
| 2021 | $4,443 | $68,780 | $31,400 | $37,380 |
| 2020 | $4,427 | $68,140 | $31,110 | $37,030 |
| 2019 | $4,320 | $66,340 | $30,290 | $36,050 |
| 2018 | $4,152 | $63,330 | $28,540 | $34,790 |
| 2017 | $4,082 | $61,000 | $27,490 | $33,510 |
| 2016 | $4,017 | $58,560 | $26,390 | $32,170 |
| 2015 | $3,975 | $55,870 | $25,180 | $30,690 |
| 2014 | $4,015 | $55,520 | $21,430 | $34,090 |
| 2013 | $3,535 | $55,680 | $21,490 | $34,190 |
Source: Public Records
Map
Nearby Homes
- 824 Dawes Ave
- 1207 S Sumner St
- 1341 S Sumner St
- 1441 Haverhill Dr Unit B
- 1416 Coolidge Ave
- 512 Pershing Ave
- 773 Farnham Ln
- 647 Farnham Ln
- 523 Kipling Ct
- 1408 E Evergreen St
- 220 E Elm St
- 1356 S Lorraine Rd Unit E
- 1000 S Lorraine Rd Unit 310
- 1000 S Lorraine Rd Unit 110
- 1010 E Illinois St
- 521 S Blanchard St
- 1523 S Prospect St
- 850 S Lorraine Rd Unit 1A
- 35 Venetian Way Cir
- 1168 Hertford Ct
- 1127 Grant St
- 1203 Grant St
- 1207 Grant St
- 1123 Grant St
- 1204 S President St
- 1126 S President St
- 1119 Grant St
- 905 Dawes Ave
- 1130 S President St
- 1130 Grant St
- 1208 S President St
- 1113 Grant St
- 1202 Grant St
- 1126 Grant St
- 921 Dawes Ave
- 1208 Grant St
- 1114 S President St
- 821 Dawes Ave
- 1114 Grant St
- 1107 Grant St