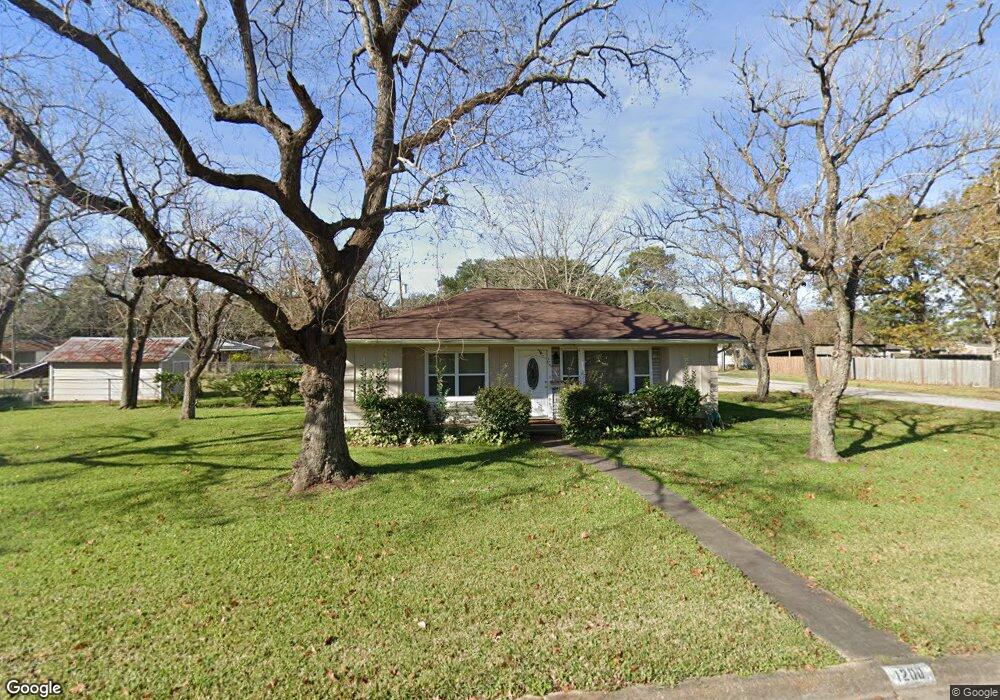
1200 Frost St Rosenberg, TX 77471
Estimated Value: $172,000 - $224,173
3
Beds
2
Baths
984
Sq Ft
$205/Sq Ft
Est. Value
About This Home
This home is located at 1200 Frost St, Rosenberg, TX 77471 and is currently estimated at $201,543, approximately $204 per square foot. 1200 Frost St is a home located in Fort Bend County with nearby schools including Bowie Elementary School, Navarro Middle School, and George Junior High School.
Ownership History
Date
Name
Owned For
Owner Type
Purchase Details
Closed on
Dec 26, 2001
Sold by
Manalli Sue Sue
Bought by
Manalli Robert Jon
Current Estimated Value
Home Financials for this Owner
Home Financials are based on the most recent Mortgage that was taken out on this home.
Original Mortgage
$69,840
Interest Rate
6.41%
Purchase Details
Closed on
Dec 20, 2001
Sold by
Manalli Robert J
Bought by
Muse Sandra
Home Financials for this Owner
Home Financials are based on the most recent Mortgage that was taken out on this home.
Original Mortgage
$69,840
Interest Rate
6.41%
Purchase Details
Closed on
Jun 19, 1997
Sold by
Prudential Residential Svcs Ltd Prtnrshp
Bought by
Manalli Robert J
Home Financials for this Owner
Home Financials are based on the most recent Mortgage that was taken out on this home.
Original Mortgage
$50,400
Interest Rate
7.93%
Purchase Details
Closed on
May 6, 1987
Sold by
Harnage Norman G Mr
Bought by
Muse Sandra
Create a Home Valuation Report for This Property
The Home Valuation Report is an in-depth analysis detailing your home's value as well as a comparison with similar homes in the area
Home Values in the Area
Average Home Value in this Area
Purchase History
| Date | Buyer | Sale Price | Title Company |
|---|---|---|---|
| Manalli Robert Jon | -- | First American Title | |
| Muse Sandra | -- | First American Title | |
| Manalli Robert J | -- | Texas American Title Co | |
| Muse Sandra | -- | -- | |
| Muse Sandra | -- | -- |
Source: Public Records
Mortgage History
| Date | Status | Borrower | Loan Amount |
|---|---|---|---|
| Open | Muse Sandra | $105,000 | |
| Closed | Muse Sandra | $77,891 | |
| Closed | Muse Sandra | $69,840 | |
| Previous Owner | Muse Sandra | $50,400 |
Source: Public Records
Tax History Compared to Growth
Tax History
| Year | Tax Paid | Tax Assessment Tax Assessment Total Assessment is a certain percentage of the fair market value that is determined by local assessors to be the total taxable value of land and additions on the property. | Land | Improvement |
|---|---|---|---|---|
| 2023 | $1,728 | $162,184 | $64,682 | $97,502 |
| 2022 | $2,285 | $147,440 | $69,020 | $78,420 |
| 2021 | $2,781 | $134,040 | $88,530 | $45,510 |
| 2020 | $2,586 | $121,850 | $96,330 | $25,520 |
| 2019 | $2,530 | $110,770 | $44,630 | $66,140 |
| 2018 | $2,337 | $100,700 | $44,630 | $56,070 |
| 2017 | $2,235 | $95,760 | $44,630 | $51,130 |
| 2016 | $2,091 | $89,590 | $44,630 | $44,960 |
| 2015 | $1,596 | $87,480 | $44,630 | $42,850 |
| 2014 | $1,880 | $92,840 | $44,630 | $48,210 |
Source: Public Records
Map
Nearby Homes
- 3326 Tilley Dr
- 1220 Mulcahy St
- 1400 Carlisle St
- 1504 Carlisle St
- 1615 Brazos St
- 2634 Wastelbread Ln
- 5503 Bowquiver Ln
- 2639 Clapbread Ln
- 1603 Walnut Ave
- 1605 Walnut Ave
- 1019 Avenue E
- 503 Willow St
- 1808 George St
- 915 Avenue E
- 428 West St
- 1314 Avenue G
- 1004 Houston St
- 413 Mulcahy St
- 1108 Easy St
- 1030 4th St