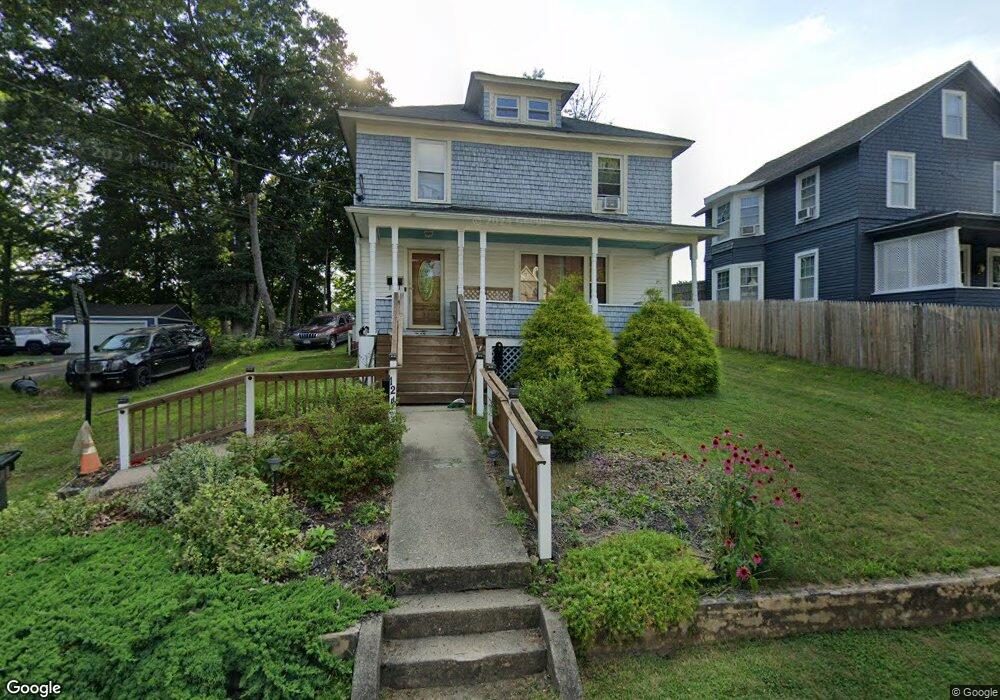
124 Orchard St Norwich, CT 06360
Central Norwich NeighborhoodEstimated Value: $241,192 - $403,000
3
Beds
2
Baths
1,534
Sq Ft
$191/Sq Ft
Est. Value
About This Home
This home is located at 124 Orchard St, Norwich, CT 06360 and is currently estimated at $293,298, approximately $191 per square foot. 124 Orchard St is a home located in New London County with nearby schools including Moriarty Magnet Elementary School, Kelly STEAM Magnet Middle School, and Integrated Day Charter School.
Ownership History
Date
Name
Owned For
Owner Type
Purchase Details
Closed on
Dec 21, 2004
Sold by
Carpenter Dolores
Bought by
Hudgins Donna
Current Estimated Value
Home Financials for this Owner
Home Financials are based on the most recent Mortgage that was taken out on this home.
Original Mortgage
$153,000
Outstanding Balance
$75,316
Interest Rate
5.68%
Estimated Equity
$217,982
Create a Home Valuation Report for This Property
The Home Valuation Report is an in-depth analysis detailing your home's value as well as a comparison with similar homes in the area
Home Values in the Area
Average Home Value in this Area
Purchase History
| Date | Buyer | Sale Price | Title Company |
|---|---|---|---|
| Hudgins Donna | $153,000 | -- | |
| Hudgins Donna | $153,000 | -- |
Source: Public Records
Mortgage History
| Date | Status | Borrower | Loan Amount |
|---|---|---|---|
| Open | Hudgins Donna | $153,000 | |
| Closed | Hudgins Donna | $153,000 | |
| Previous Owner | Hudgins Donna | $40,867 |
Source: Public Records
Tax History
| Year | Tax Paid | Tax Assessment Tax Assessment Total Assessment is a certain percentage of the fair market value that is determined by local assessors to be the total taxable value of land and additions on the property. | Land | Improvement |
|---|---|---|---|---|
| 2025 | $4,990 | $123,300 | $25,600 | $97,700 |
| 2024 | $4,710 | $123,300 | $25,600 | $97,700 |
| 2023 | $3,745 | $77,000 | $18,100 | $58,900 |
| 2022 | $3,733 | $77,000 | $18,100 | $58,900 |
| 2021 | $3,745 | $77,000 | $18,100 | $58,900 |
| 2020 | $3,732 | $77,000 | $18,100 | $58,900 |
| 2019 | $3,695 | $77,000 | $18,100 | $58,900 |
| 2018 | $3,707 | $76,600 | $21,400 | $55,200 |
| 2017 | $3,733 | $76,600 | $21,400 | $55,200 |
| 2016 | $3,758 | $76,600 | $21,400 | $55,200 |
| 2015 | $3,681 | $76,600 | $21,400 | $55,200 |
| 2014 | $3,518 | $76,600 | $21,400 | $55,200 |
Source: Public Records
Map
Nearby Homes
Your Personal Tour Guide
Ask me questions while you tour the home.