
128 Fuller St Hemphill, TX 75948
Estimated payment $163/month
Highlights
- No HOA
- Wood Fence
- Level Lot
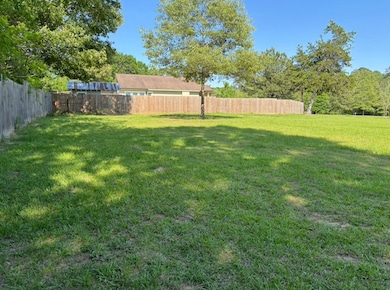
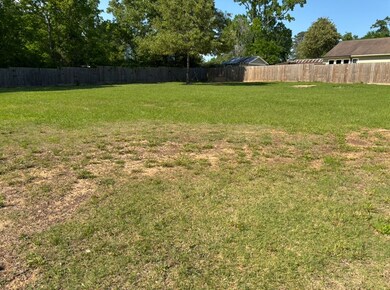
About This Lot
Beautiful cleared lots located in Hemphill - just a few blocks from courthouse square - offering a peaceful view of a pond. Off the main road, the property offers a country feel, but with the town's amenities near. Dirt work, drainage work and culvert all complete. Privacy fence on one side. Utilities available at road. If you're thinking of building, you owe it to yourself to take a look!
Listing Agent
Allman Company Brokerage Email: 4097873333, shane@allmancompany.net License #TREC #0626144 Listed on: 04/15/2025
Property Details
Property Type
- Land
Est. Annual Taxes
- $1,813
Lot Details
- 0.33 Acre Lot
- Dirt Road
- Wood Fence
- Level Lot
Community Details
- No Home Owners Association
Map
Home Values in the Area
Average Home Value in this Area
Tax History
| Year | Tax Paid | Tax Assessment Tax Assessment Total Assessment is a certain percentage of the fair market value that is determined by local assessors to be the total taxable value of land and additions on the property. | Land | Improvement |
|---|---|---|---|---|
| 2024 | $1,813 | $212,410 | $6,220 | $206,190 |
| 2023 | $1,271 | $107,380 | $1,960 | $105,420 |
| 2022 | $1,550 | $107,380 | $1,960 | $105,420 |
| 2021 | $1,614 | $107,380 | $1,960 | $105,420 |
| 2020 | $1,792 | $106,920 | $1,500 | $105,420 |
| 2019 | $1,779 | $106,920 | $1,500 | $105,420 |
| 2018 | $1,779 | $106,920 | $1,500 | $105,420 |
| 2017 | -- | $106,920 | $1,500 | $105,420 |
| 2016 | -- | $75,950 | $1,500 | $74,450 |
Property History
| Date | Event | Price | Change | Sq Ft Price |
|---|---|---|---|---|
| 04/15/2025 04/15/25 | For Sale | $25,000 | -- | -- |
Source: Lufkin Association of REALTORS®
MLS Number: 5104435
APN: R006029801
- 630 Worth St
- 152 N Oak St
- 780 Worth St
- 805 Worth St
- 110 Market St
- 374 Starr St
- 0 Beckcom Rd
- 6032176 Beckcom Rd
- 870 Worth St
- 301 Lillian St
- 1100 Worth St
- 135 Willow St
- 2090 Worth St
- 926 Texas St
- 3838 Texas State Highway 87
- 182 Allie Ln
- 175 Mayfield St
- 1430 State Highway 87 S
- 1430 Texas 87
- 155 G R Bryan Ln
