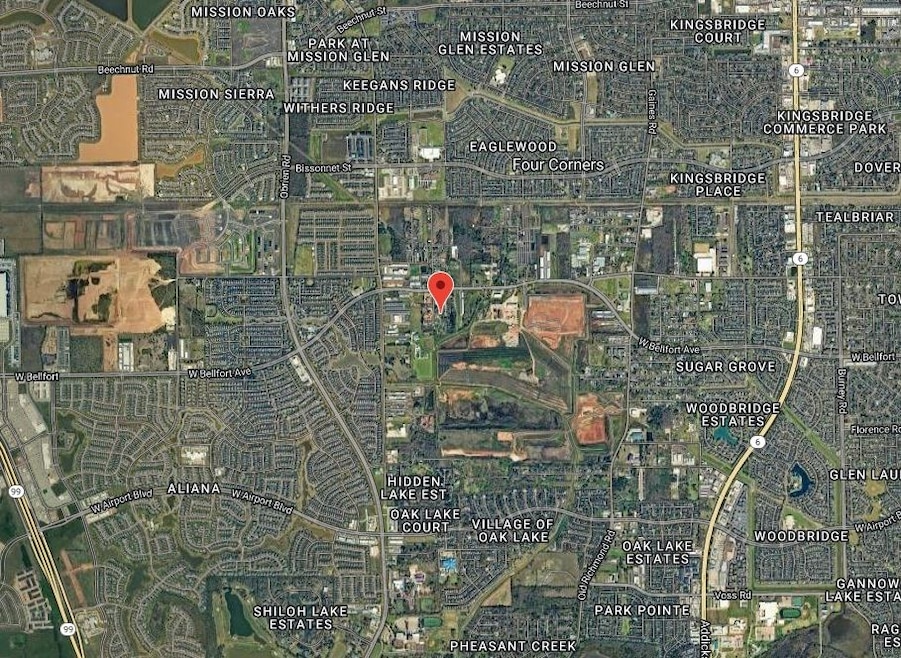
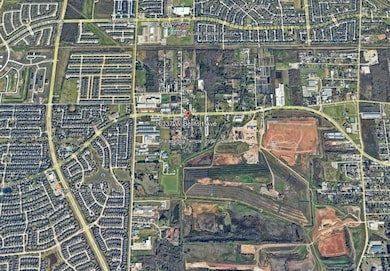
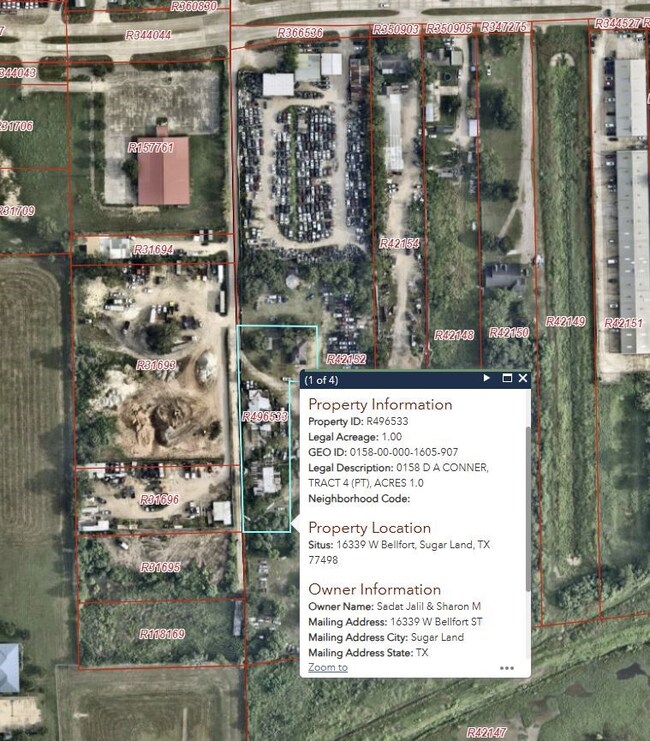
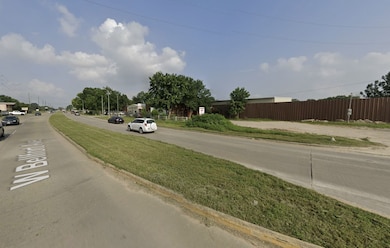
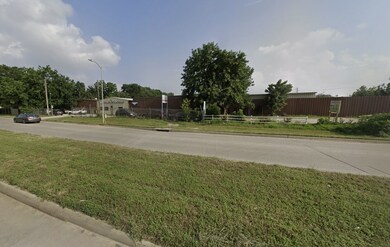
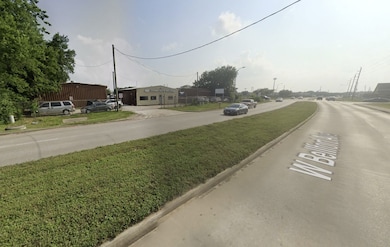
16337 W Bellfort Sugar Land, TX 77498
Four Corners NeighborhoodEstimated payment $39,894/month
Highlights
- 8.21 Acre Lot
- Partially Wooded Lot
- Level Lot
- Oyster Creek Elementary School Rated A
- Open Space
About This Lot
This property is currently leased for nine thousand a month.
Property Details
Property Type
- Land
Est. Annual Taxes
- $33,403
Lot Details
- 8.21 Acre Lot
- Open Space
- Level Lot
- Partially Wooded Lot
- Additional Parcels
- May Be Possible The Lot Can Be Split Into 2+ Parcels
Schools
- Holley Elementary School
- Garcia Middle School
- Austin High School
Utilities
- Phone Available
- Cable TV Available
Community Details
- D A Conner Subdivision
Map
Home Values in the Area
Average Home Value in this Area
Tax History
| Year | Tax Paid | Tax Assessment Tax Assessment Total Assessment is a certain percentage of the fair market value that is determined by local assessors to be the total taxable value of land and additions on the property. | Land | Improvement |
|---|---|---|---|---|
| 2023 | $33,403 | $1,640,109 | $1,536,057 | $104,052 |
| 2022 | $24,501 | $1,114,073 | $1,017,870 | $96,203 |
| 2021 | $25,262 | $1,101,731 | $1,017,870 | $83,861 |
| 2020 | $10,629 | $457,490 | $370,130 | $87,360 |
| 2019 | $13,671 | $566,034 | $421,480 | $144,554 |
| 2018 | $12,591 | $520,250 | $421,480 | $98,770 |
| 2017 | $12,672 | $518,260 | $421,480 | $96,780 |
| 2016 | $4,613 | $188,650 | $91,800 | $96,850 |
| 2015 | $4,541 | $185,000 | $91,800 | $93,200 |
| 2014 | $4,548 | $183,860 | $91,800 | $92,060 |
Property History
| Date | Event | Price | Change | Sq Ft Price |
|---|---|---|---|---|
| 12/18/2024 12/18/24 | Price Changed | $6,700,000 | -3.6% | -- |
| 09/23/2024 09/23/24 | Price Changed | $6,950,000 | +6.9% | -- |
| 09/21/2024 09/21/24 | For Sale | $6,499,999 | -- | -- |
Purchase History
| Date | Type | Sale Price | Title Company |
|---|---|---|---|
| Deed | -- | -- |
Mortgage History
| Date | Status | Loan Amount | Loan Type |
|---|---|---|---|
| Closed | $140,000 | Unknown |
Source: Houston Association of REALTORS®
MLS Number: 95882128
APN: 0158-00-000-1600-907
Disclaimer: Certain information contained herein is derived from information provided by parties other than Homes.com. All information provided is deemed reliable, but is not guaranteed to be accurate and should be independently verified.
![]() Copyright 2025, Houston REALTORS® Information Service, Inc.
Copyright 2025, Houston REALTORS® Information Service, Inc.
The information provided is exclusively for consumers’ personal, non-commercial use, and may not be used for any purpose other than to identify prospective properties consumers may be interested in purchasing.
Information is deemed reliable but not guaranteed.
- 10437 Clodine Rd
- 10311 Belvamera Rd
- 16927 Kaitlyn Kerria Ct
- 0 Sam Brookins St
- 16726 Aliana Lakes Ct
- 16915 Cory Cornel Ln
- 17031 Iver Ironwood Trail
- 16142 Crooked Arrow Dr
- 17123 Audrey Arbor Way
- 9823 Corben Creek Ln
- 16818 Talisker Dr
- 16819 Talisker Dr
- 16919 Talisker Ct
- 17015 Kirkton Moor Dr
- 17115 Cory Cornell Ln
- 17134 Devon Dogwood Trail
- 17138 Devon Dogwood Trail
- 17022 Huttons Court Ln
- 17106 Simon Ct
- 16310 Autumn Leigh Dr
- 17022 Kaitlyn Kerria Ct
- 16020 1/2 Sam Brookins St
- 16919 Talisker Ct
- 16614 New Market Ln
- 9514 Sedge Wren Ct
- 17000 Bissonnet St
- 16306 Soaring Eagle Dr
- 16403 Lynn Crest Ct
- 9507 Flying Eagle Ct
- 16315 Lynn Crest Ct
- 16127 Eaglewood Spring Ct
- 17419 Woodfalls Ln
- 9318 Windswept Grove Dr
- 9318 Windswept Grove Dr
- 8522 Chancellorsville Ln
- 8522 Chickamauga Ln
- 17503 Woodfalls Ln
- 17507 Tulip Meadow Rd
- 16302 Flint Run Way
- 16307 Ginger Run Way
