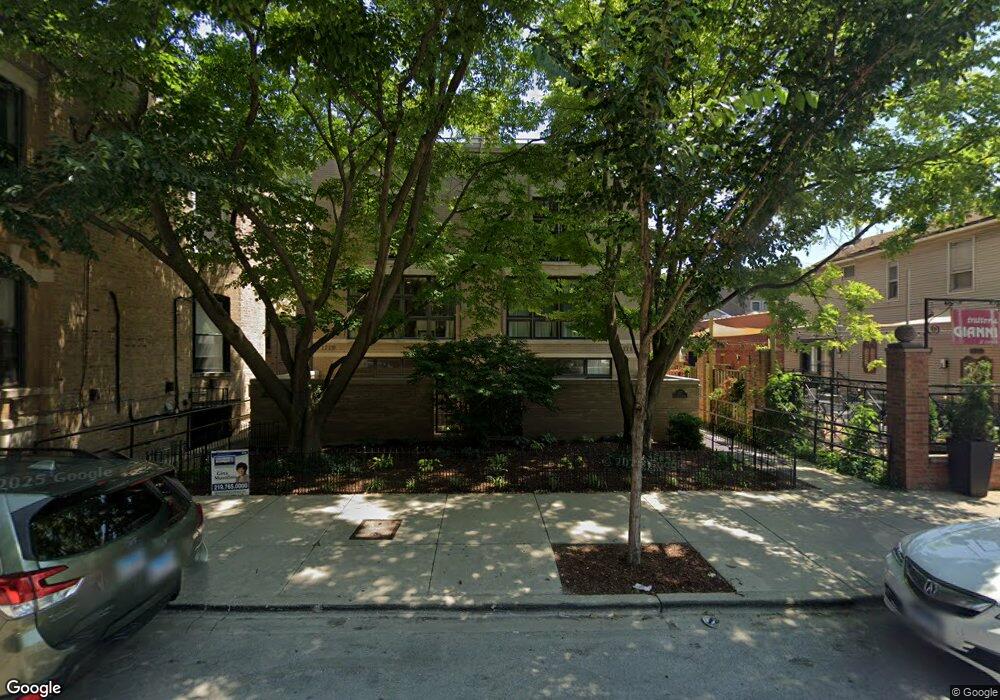
1717 N Halsted St Unit 1717B Chicago, IL 60614
Old Town NeighborhoodEstimated Value: $615,000 - $757,000
2
Beds
2
Baths
2,000
Sq Ft
$350/Sq Ft
Est. Value
About This Home
This home is located at 1717 N Halsted St Unit 1717B, Chicago, IL 60614 and is currently estimated at $700,701, approximately $350 per square foot. 1717 N Halsted St Unit 1717B is a home located in Cook County with nearby schools including Mayer Elementary School, Lincoln Park High School, and The Noble Academy.
Ownership History
Date
Name
Owned For
Owner Type
Purchase Details
Closed on
Aug 15, 2006
Sold by
Lazarevic Milenko
Bought by
Lazarevic Dusanka
Current Estimated Value
Purchase Details
Closed on
Nov 29, 2004
Sold by
Horwath Richard and Horwath Vandenbossche
Bought by
Lazarevic Milenko and Lazarevic Dusanka
Home Financials for this Owner
Home Financials are based on the most recent Mortgage that was taken out on this home.
Original Mortgage
$300,000
Interest Rate
5.71%
Mortgage Type
Purchase Money Mortgage
Purchase Details
Closed on
Jun 1, 1994
Sold by
Fox Steven G
Bought by
Bossche Anne M Vanden
Home Financials for this Owner
Home Financials are based on the most recent Mortgage that was taken out on this home.
Original Mortgage
$127,800
Interest Rate
6%
Create a Home Valuation Report for This Property
The Home Valuation Report is an in-depth analysis detailing your home's value as well as a comparison with similar homes in the area
Home Values in the Area
Average Home Value in this Area
Purchase History
| Date | Buyer | Sale Price | Title Company |
|---|---|---|---|
| Lazarevic Dusanka | -- | None Available | |
| Lazarevic Milenko | $415,000 | Git | |
| Bossche Anne M Vanden | $213,000 | -- |
Source: Public Records
Mortgage History
| Date | Status | Borrower | Loan Amount |
|---|---|---|---|
| Previous Owner | Lazarevic Milenko | $300,000 | |
| Previous Owner | Bossche Anne M Vanden | $127,800 |
Source: Public Records
Tax History Compared to Growth
Tax History
| Year | Tax Paid | Tax Assessment Tax Assessment Total Assessment is a certain percentage of the fair market value that is determined by local assessors to be the total taxable value of land and additions on the property. | Land | Improvement |
|---|---|---|---|---|
| 2024 | $10,971 | $61,651 | $18,030 | $43,621 |
| 2023 | $10,695 | $52,000 | $14,540 | $37,460 |
| 2022 | $10,695 | $52,000 | $14,540 | $37,460 |
| 2021 | $10,456 | $51,999 | $14,540 | $37,459 |
| 2020 | $10,563 | $47,418 | $12,795 | $34,623 |
| 2019 | $10,172 | $50,631 | $12,795 | $37,836 |
| 2018 | $10,173 | $51,500 | $12,795 | $38,705 |
| 2017 | $8,541 | $39,674 | $10,469 | $29,205 |
| 2016 | $7,946 | $39,674 | $10,469 | $29,205 |
| 2015 | $7,270 | $39,674 | $10,469 | $29,205 |
| 2014 | $7,755 | $41,799 | $7,851 | $33,948 |
| 2013 | $7,602 | $41,799 | $7,851 | $33,948 |
Source: Public Records
Map
Nearby Homes
- 1655 N Halsted St Unit 2
- 1631 N Halsted St
- 1629 N Halsted St
- 1719 N Burling St Unit 2S
- 1625 N Halsted St
- 1623 N Halsted St
- 1625 N Burling St Unit 401
- 1625 N Burling St Unit 101
- 1646 N Orchard St Unit 2
- 1646 N Orchard St Unit 3S
- 1646 N Orchard St Unit 1S
- 1600 N Halsted St Unit 3C
- 1648 N Bissell St
- 1719 N Fremont St
- 1725 N Fremont St
- 658 W Willow St
- 1705 N Clybourn Ave Unit H
- 1836 N Dayton St Unit 1836
- 1851 N Halsted St Unit 2
- 1853 N Burling St
- 1717 N Halsted St Unit 1719C
- 1717 N Halsted St Unit 1719A
- 1717 N Halsted St Unit 1719B
- 1717 N Halsted St Unit 1717A
- 1717 N Halsted St Unit 1717C
- 1717 N Halsted St Unit C
- 1719 N Halsted St Unit A
- 1719 N Halsted St Unit B
- 1719 N Halsted St Unit B
- 1719 N Halsted St Unit C
- 1713 N Halsted St
- 1711 N Halsted St
- 1711 N Halsted St Unit 2
- 1721 N Halsted St
- 1725 N Halsted St
- 1725 N Halsted St
- 1725 N Halsted St Unit 3
- 1725 N Halsted St Unit 3 AE
- 1716 N Burling St
- 1729 N Halsted St