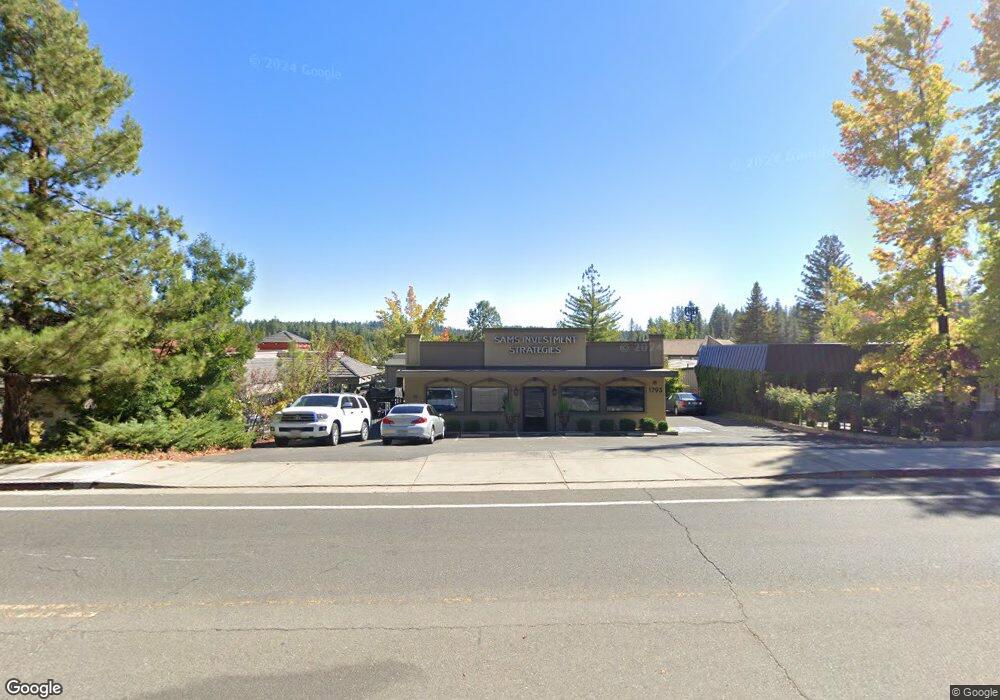
1793 E Main St Grass Valley, CA 95945
--
Bed
--
Bath
2,288
Sq Ft
8,712
Sq Ft Lot
About This Home
This home is located at 1793 E Main St, Grass Valley, CA 95945. 1793 E Main St is a home located in Nevada County with nearby schools including Bell Hill Academy, Margaret G. Scotten Elementary School, and Lyman Gilmore Middle School.
Ownership History
Date
Name
Owned For
Owner Type
Purchase Details
Closed on
Apr 26, 2013
Sold by
Tri Counties Bank
Bought by
Sams Eric C and Sams Lori M
Home Financials for this Owner
Home Financials are based on the most recent Mortgage that was taken out on this home.
Original Mortgage
$280,000
Interest Rate
3.51%
Mortgage Type
Construction
Purchase Details
Closed on
Apr 30, 2012
Sold by
Nestore Terri and The Terri Nestore Trust
Bought by
Tri Counties Bank and Citizens Bank Of Northern California
Purchase Details
Closed on
Jul 13, 2004
Sold by
Downing Lewis Ray and Downing Pauline F
Bought by
Nestore Terri and Terri Nestore Trust
Home Financials for this Owner
Home Financials are based on the most recent Mortgage that was taken out on this home.
Original Mortgage
$225,000
Interest Rate
6.27%
Mortgage Type
Commercial
Create a Home Valuation Report for This Property
The Home Valuation Report is an in-depth analysis detailing your home's value as well as a comparison with similar homes in the area
Home Values in the Area
Average Home Value in this Area
Purchase History
| Date | Buyer | Sale Price | Title Company |
|---|---|---|---|
| Sams Eric C | $185,000 | Placer Title Company | |
| Tri Counties Bank | $174,000 | Placer Title | |
| Nestore Terri | $350,000 | Fidelity National Title Co |
Source: Public Records
Mortgage History
| Date | Status | Borrower | Loan Amount |
|---|---|---|---|
| Open | Sams Eric C | $275,000 | |
| Closed | Sams Eric C | $280,000 | |
| Previous Owner | Nestore Terri | $225,000 |
Source: Public Records
Tax History Compared to Growth
Tax History
| Year | Tax Paid | Tax Assessment Tax Assessment Total Assessment is a certain percentage of the fair market value that is determined by local assessors to be the total taxable value of land and additions on the property. | Land | Improvement |
|---|---|---|---|---|
| 2025 | $3,316 | $314,837 | $153,922 | $160,915 |
| 2024 | $3,236 | $308,664 | $150,904 | $157,760 |
| 2023 | $3,236 | $302,613 | $147,946 | $154,667 |
| 2022 | $3,208 | $296,681 | $145,046 | $151,635 |
| 2021 | $3,138 | $290,864 | $142,202 | $148,662 |
| 2020 | $3,136 | $287,882 | $140,744 | $147,138 |
| 2019 | $3,006 | $282,238 | $137,985 | $144,253 |
| 2018 | $0 | $276,705 | $135,280 | $141,425 |
| 2017 | $2,876 | $271,281 | $132,628 | $138,653 |
| 2016 | $2,771 | $265,963 | $130,028 | $135,935 |
| 2015 | $2,732 | $261,969 | $128,075 | $133,894 |
| 2014 | $2,691 | $256,839 | $125,567 | $131,272 |
Source: Public Records
Map
Nearby Homes
- 262 W Olympia Dr
- 287 W Olympia Dr
- 427 Woodland Way
- 549 Glenwood Rd
- 990 Laurel Ln
- 1025 Amber Loop
- 606 Glenwood Rd
- 917 Pampas Dr
- 987 Pampas Dr
- 660 Glenwood Rd
- 432 Glenwood Pines Ct
- 607 Coldspring Ct
- 1517 Mulberry Dr
- 506 Liberty Ct
- 1536 Mulberry Dr
- 15604 Ridge Estates Rd
- 15498 Ridge Estates Rd
- 318 Shamrock Dr
- 314 Shamrock Dr
- 315 Shamrock Dr
- 734 Maltman Dr
- 1781 E Main St
- 1784 E Main St
- 1802 E Main St
- 0 Maltman Dr Unit 19039586
- 0 Maltman Dr
- 160 Glenbrook Dr
- 160 Glenbrook Dr
- 183 Glenbrook Dr
- 177 Glenbrook Dr
- 193 Glenbrook Dr
- 10184 Glenbrook Dr
- 1740 E Main St
- 715 Maltman Dr
- 207 Glenbrook Dr
- 11708 Nevada City Hwy
- 1744 E Main St
- 1720 E Main St