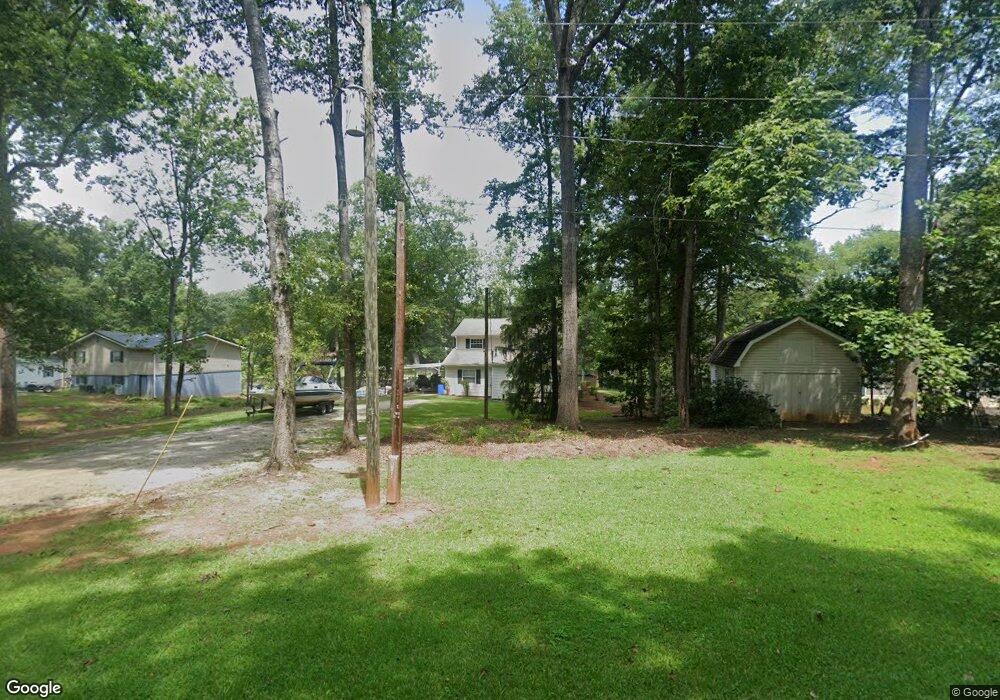
184 Riverview Rd Eatonton, GA 31024
Estimated Value: $517,000 - $606,000
--
Bed
2
Baths
2,066
Sq Ft
$269/Sq Ft
Est. Value
About This Home
This home is located at 184 Riverview Rd, Eatonton, GA 31024 and is currently estimated at $554,951, approximately $268 per square foot. 184 Riverview Rd is a home located in Putnam County with nearby schools including Putnam County Primary School, Putnam County Elementary School, and Putnam County Middle School.
Ownership History
Date
Name
Owned For
Owner Type
Purchase Details
Closed on
Dec 15, 2008
Sold by
Not Provided
Bought by
Crosby James P and Crosby Valerie C
Current Estimated Value
Purchase Details
Closed on
Oct 16, 2008
Sold by
Crosby Jeremy Philip
Bought by
Corsby James Philip
Purchase Details
Closed on
Jun 16, 2003
Sold by
Crosby Jeremy and James Phillip
Bought by
Crosby Jeremy and James Phillip Crosb
Purchase Details
Closed on
Apr 24, 2003
Sold by
Crosby Jeremy and James Phillip
Bought by
Crosby Jeremy Phillip
Purchase Details
Closed on
Oct 15, 2002
Sold by
Crosby Jeremy
Bought by
Crosby Jeremy and James Phillip Crosb
Purchase Details
Closed on
Jul 24, 2002
Sold by
Johnson Marion F
Bought by
Crosby Jeremy
Purchase Details
Closed on
Mar 21, 2001
Sold by
Ivester Martha Sue
Bought by
Johnson Marion F
Purchase Details
Closed on
Oct 25, 1994
Sold by
Garner Mattielene H
Bought by
Ivester Martha Sue
Purchase Details
Closed on
Jun 25, 1988
Bought by
Garner Mattielene H
Create a Home Valuation Report for This Property
The Home Valuation Report is an in-depth analysis detailing your home's value as well as a comparison with similar homes in the area
Home Values in the Area
Average Home Value in this Area
Purchase History
| Date | Buyer | Sale Price | Title Company |
|---|---|---|---|
| Crosby James P | -- | -- | |
| Corsby James Philip | -- | -- | |
| Crosby Jeremy | -- | -- | |
| Crosby Jeremy Phillip | -- | -- | |
| Crosby Jeremy | -- | -- | |
| Crosby Jeremy | $135,000 | -- | |
| Johnson Marion F | $95,000 | -- | |
| Ivester Martha Sue | $85,000 | -- | |
| Garner Mattielene H | $110,000 | -- |
Source: Public Records
Tax History Compared to Growth
Tax History
| Year | Tax Paid | Tax Assessment Tax Assessment Total Assessment is a certain percentage of the fair market value that is determined by local assessors to be the total taxable value of land and additions on the property. | Land | Improvement |
|---|---|---|---|---|
| 2024 | $2,685 | $183,379 | $85,500 | $97,879 |
| 2023 | $2,685 | $163,413 | $85,500 | $77,913 |
| 2022 | $3,117 | $155,223 | $82,650 | $72,573 |
| 2021 | $2,725 | $119,582 | $62,700 | $56,882 |
| 2020 | $2,643 | $109,088 | $60,000 | $49,088 |
| 2019 | $2,662 | $99,603 | $60,000 | $39,603 |
| 2018 | $2,488 | $99,603 | $60,000 | $39,603 |
| 2017 | $2,246 | $99,603 | $60,000 | $39,603 |
| 2016 | $2,248 | $99,603 | $60,000 | $39,603 |
| 2015 | $2,167 | $99,603 | $60,000 | $39,603 |
| 2014 | $2,224 | $102,103 | $62,500 | $39,603 |
Source: Public Records
Map
Nearby Homes
- 325A Shelton Dr
- 129 Tanglewood Rd SW
- 296 Shelton Dr
- 0 Twin Bridges Rd Unit 24901366
- 0 Twin Bridges Rd Unit 11579160
- 0 Twin Bridges Rd Unit 52908
- 0 Twin Bridges Rd Unit 10545486
- 100 Tanglewood Rd SW
- 0 Napier Mill Rd Unit 10571087
- 0 Napier Dr SW Unit 7515422
- 0 Napier Dr SW Unit 10448037
- 230 Shelton Dr
- 101 A W Bear Creek Rd
- 101 W A Bear Creek Rd
- 103 Bear Creek Rd
- 101 W Blue Branch Rd
- 118 Napier Mill Rd SW
- 459 Avant Rd
- 0 Mcdade Rd Unit 10545345
- 0 Mcdade Rd Unit 10545336
- 182 Riverview Rd SW
- 186 Riverview Rd
- 188 Riverview Rd
- 188 Riverview Rd Unit 4
- 188 Riverview Rd SW
- 180 Riverview Rd
- 180 Riverview Rd SW
- 190 Riverview Rd
- 190 Riverview Rd Unit 5
- 194 Riverview Rd
- 149 Little Riverview Rd
- 143 Little Riverview Rd Unit 3
- 143 Little Riverview Rd
- 147 Little Riverview Rd
- 176 Riverview Rd
- 176 Riverview Rd
- 145 Little Riverview Rd Unit 2
- 145 Little Riverview Rd
- 198 Riverview Rd
- 137 Little Riverview Rd