
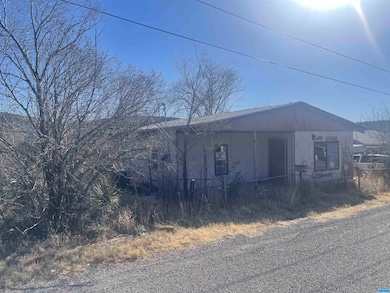
19 Geronimo St Hurley, NM 88043
Estimated payment $197/month
About This Home
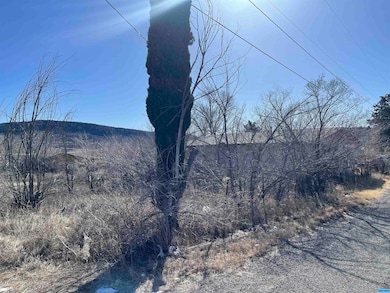
This cozy home sits on a .247-acre lot with wide open views to the south and west. Lush trees surrounding the property add to its charm. The home features 2 bedrooms, 1 bathroom. Home is a fixer-upper, you can flip or start over with your ideal home.
Home Details
Home Type
- Single Family
Est. Annual Taxes
- $374
Year Built
- Built in 1945
Parking
- No Garage
Home Design
- 1,028 Sq Ft Home
Bedrooms and Bathrooms
- 2 Bedrooms
- 1 Full Bathroom
Additional Features
- 10,454 Sq Ft Lot
- No Heating
Listing and Financial Details
- Assessor Parcel Number R081512
Map
Home Values in the Area
Average Home Value in this Area
Tax History
| Year | Tax Paid | Tax Assessment Tax Assessment Total Assessment is a certain percentage of the fair market value that is determined by local assessors to be the total taxable value of land and additions on the property. | Land | Improvement |
|---|---|---|---|---|
| 2024 | $335 | $19,146 | $659 | $18,487 |
| 2023 | $335 | $18,852 | $659 | $18,193 |
| 2022 | $293 | $18,303 | $659 | $17,644 |
| 2021 | $291 | $17,770 | $659 | $17,111 |
| 2020 | $280 | $17,252 | $659 | $16,593 |
| 2019 | $268 | $16,750 | $659 | $16,091 |
| 2018 | $251 | $16,262 | $659 | $15,603 |
| 2017 | $242 | $15,789 | $659 | $15,130 |
| 2016 | $246 | $15,329 | $659 | $14,670 |
| 2015 | $252 | $15,329 | $659 | $14,670 |
| 2014 | $263 | $15,329 | $659 | $14,670 |
| 2012 | $237 | $15,265 | $659 | $14,606 |
Property History
| Date | Event | Price | Change | Sq Ft Price |
|---|---|---|---|---|
| 04/07/2025 04/07/25 | For Sale | $30,000 | 0.0% | $29 / Sq Ft |
| 03/05/2025 03/05/25 | Pending | -- | -- | -- |
| 01/28/2025 01/28/25 | Price Changed | $30,000 | -14.3% | $29 / Sq Ft |
| 04/09/2024 04/09/24 | For Sale | $35,000 | -- | $34 / Sq Ft |
Purchase History
| Date | Type | Sale Price | Title Company |
|---|---|---|---|
| Warranty Deed | -- | -- |
Source: Silver City Regional Multiple Listing Service
MLS Number: 40260
APN: 3072106518417
Disclaimer: Certain information contained herein is derived from information provided by parties other than Homes.com. All information provided is deemed reliable, but is not guaranteed to be accurate and should be independently verified.
![]() IDX information is provided exclusively for personal, non-commercial use, and may not be used for any purpose other than to identify prospective properties consumers may be interested in purchasing. Information is deemed reliable but not guaranteed.
IDX information is provided exclusively for personal, non-commercial use, and may not be used for any purpose other than to identify prospective properties consumers may be interested in purchasing. Information is deemed reliable but not guaranteed.
