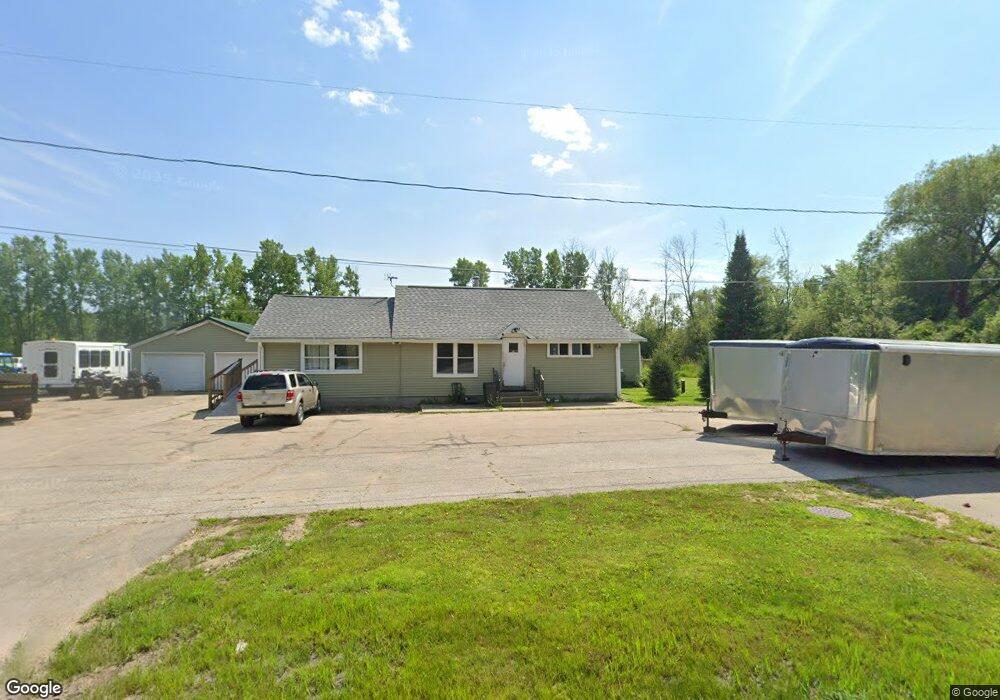
2372 Doran St Oconto, WI 54153
Estimated Value: $298,732
5
Beds
3
Baths
2,528
Sq Ft
$118/Sq Ft
Est. Value
About This Home
This home is located at 2372 Doran St, Oconto, WI 54153 and is currently estimated at $298,732, approximately $118 per square foot. 2372 Doran St is a home located in Oconto County with nearby schools including Oconto Elementary School, Oconto Middle School, and Oconto High School.
Ownership History
Date
Name
Owned For
Owner Type
Purchase Details
Closed on
Jan 3, 2022
Sold by
Reed Paul J
Bought by
Mcfadden Steven T
Current Estimated Value
Purchase Details
Closed on
Nov 20, 2020
Sold by
Country Club Llc
Bought by
Reed Paul J
Home Financials for this Owner
Home Financials are based on the most recent Mortgage that was taken out on this home.
Interest Rate
2.72%
Purchase Details
Closed on
Jul 26, 2013
Sold by
The Country Club Llc
Bought by
Johnson Barbara
Create a Home Valuation Report for This Property
The Home Valuation Report is an in-depth analysis detailing your home's value as well as a comparison with similar homes in the area
Home Values in the Area
Average Home Value in this Area
Purchase History
| Date | Buyer | Sale Price | Title Company |
|---|---|---|---|
| Mcfadden Steven T | $100 | Rl Hall Land Title Co. | |
| Reed Paul J | $140,000 | -- | |
| Reed | $140,000 | -- | |
| Johnson Barbara | $2,000 | -- |
Source: Public Records
Mortgage History
| Date | Status | Borrower | Loan Amount |
|---|---|---|---|
| Previous Owner | Reed | -- |
Source: Public Records
Tax History
| Year | Tax Paid | Tax Assessment Tax Assessment Total Assessment is a certain percentage of the fair market value that is determined by local assessors to be the total taxable value of land and additions on the property. | Land | Improvement |
|---|---|---|---|---|
| 2025 | $2,284 | $99,100 | $26,500 | $72,600 |
| 2024 | $2,784 | $99,100 | $26,500 | $72,600 |
| 2023 | $1,729 | $100,400 | $27,800 | $72,600 |
| 2022 | $1,519 | $100,400 | $27,800 | $72,600 |
| 2021 | $1,243 | $88,600 | $26,800 | $61,800 |
| 2020 | $1,358 | $88,600 | $26,800 | $61,800 |
| 2019 | $1,513 | $86,900 | $26,000 | $60,900 |
| 2018 | $1,434 | $86,900 | $26,000 | $60,900 |
| 2017 | $1,384 | $86,900 | $26,000 | $60,900 |
| 2016 | $1,438 | $86,900 | $26,000 | $60,900 |
| 2015 | $1,386 | $86,900 | $26,000 | $60,900 |
| 2013 | $1,479 | $85,400 | $26,000 | $59,400 |
Source: Public Records
Map
Nearby Homes
Your Personal Tour Guide
Ask me questions while you tour the home.