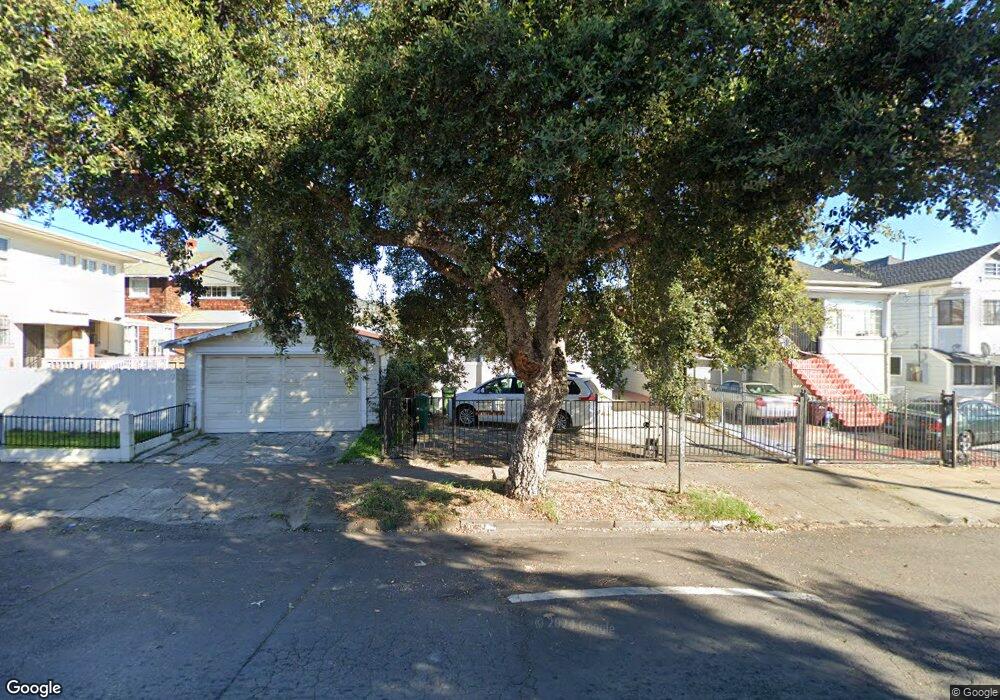
2420 E 20th St Oakland, CA 94601
Meadow Brook NeighborhoodEstimated Value: $572,000 - $778,000
5
Beds
3
Baths
1,738
Sq Ft
$390/Sq Ft
Est. Value
About This Home
This home is located at 2420 E 20th St, Oakland, CA 94601 and is currently estimated at $678,004, approximately $390 per square foot. 2420 E 20th St is a home located in Alameda County with nearby schools including Manzanita Community School, Manzanita Seed Elementary School, and Roosevelt Middle School.
Ownership History
Date
Name
Owned For
Owner Type
Purchase Details
Closed on
Aug 27, 2022
Sold by
Ly and Mui
Bought by
Ly David
Current Estimated Value
Purchase Details
Closed on
Feb 21, 2007
Sold by
Wilson Ly Loc A and Wilson Ly
Bought by
Ly Wilson
Home Financials for this Owner
Home Financials are based on the most recent Mortgage that was taken out on this home.
Original Mortgage
$150,000
Interest Rate
6%
Mortgage Type
Unknown
Purchase Details
Closed on
Jul 19, 2006
Sold by
Ly Wilson
Bought by
Ly Wilson and Phung Mui
Purchase Details
Closed on
Oct 4, 2005
Sold by
Phung Mui
Bought by
Ly Wilson
Purchase Details
Closed on
Feb 9, 1996
Sold by
Burkhardt Dorothy J
Bought by
Ly Loc A
Home Financials for this Owner
Home Financials are based on the most recent Mortgage that was taken out on this home.
Original Mortgage
$93,750
Interest Rate
6.99%
Create a Home Valuation Report for This Property
The Home Valuation Report is an in-depth analysis detailing your home's value as well as a comparison with similar homes in the area
Home Values in the Area
Average Home Value in this Area
Purchase History
| Date | Buyer | Sale Price | Title Company |
|---|---|---|---|
| Ly David | -- | -- | |
| Ly Wilson | -- | Commonwealth Land Title | |
| Ly Wilson | -- | None Available | |
| Ly Wilson | -- | -- | |
| Wilson Ly Loc A | -- | Commonwealth Land Title | |
| Ly Loc A | $125,000 | Chicago Title Co |
Source: Public Records
Mortgage History
| Date | Status | Borrower | Loan Amount |
|---|---|---|---|
| Previous Owner | Ly Wilson | $150,000 | |
| Previous Owner | Ly Loc A | $30,000 | |
| Previous Owner | Ly Loc A | $100,000 | |
| Previous Owner | Ly Loc A | $93,750 | |
| Closed | Ly Loc A | $12,500 |
Source: Public Records
Tax History Compared to Growth
Tax History
| Year | Tax Paid | Tax Assessment Tax Assessment Total Assessment is a certain percentage of the fair market value that is determined by local assessors to be the total taxable value of land and additions on the property. | Land | Improvement |
|---|---|---|---|---|
| 2025 | $11,708 | $750,225 | $225,067 | $525,158 |
| 2024 | $11,708 | $735,520 | $220,656 | $514,864 |
| 2023 | $12,257 | $721,098 | $216,329 | $504,769 |
| 2022 | $11,873 | $706,960 | $212,088 | $494,872 |
| 2021 | $11,315 | $693,100 | $207,930 | $485,170 |
| 2020 | $11,189 | $685,994 | $205,798 | $480,196 |
| 2019 | $10,367 | $645,000 | $193,500 | $451,500 |
| 2018 | $9,638 | $595,000 | $178,500 | $416,500 |
| 2017 | $8,466 | $525,000 | $157,500 | $367,500 |
| 2016 | $7,098 | $434,000 | $130,200 | $303,800 |
| 2015 | $5,862 | $340,000 | $102,000 | $238,000 |
| 2014 | $5,086 | $275,000 | $82,500 | $192,500 |
Source: Public Records
Map
Nearby Homes
- 2510 E 21st St
- 2340 E 21st St
- 2017 27th Ave
- 2021 27th Ave
- 2227 25th Ave
- 2222 Inyo Ave
- 2004 27th Ave
- 2401 Foothill Blvd
- 2304 E 22nd St
- 2140 27th Ave
- 2373 Foothill Blvd
- 2222 23rd Ave
- 2230 23rd Ave
- 2538 E 16th St Unit 1
- 2246 23rd Ave
- 1607 Miller Ave
- 2775 E 21st St
- 2207 E 21st St
- 2520 E 24th St
- 2207 E 19th St