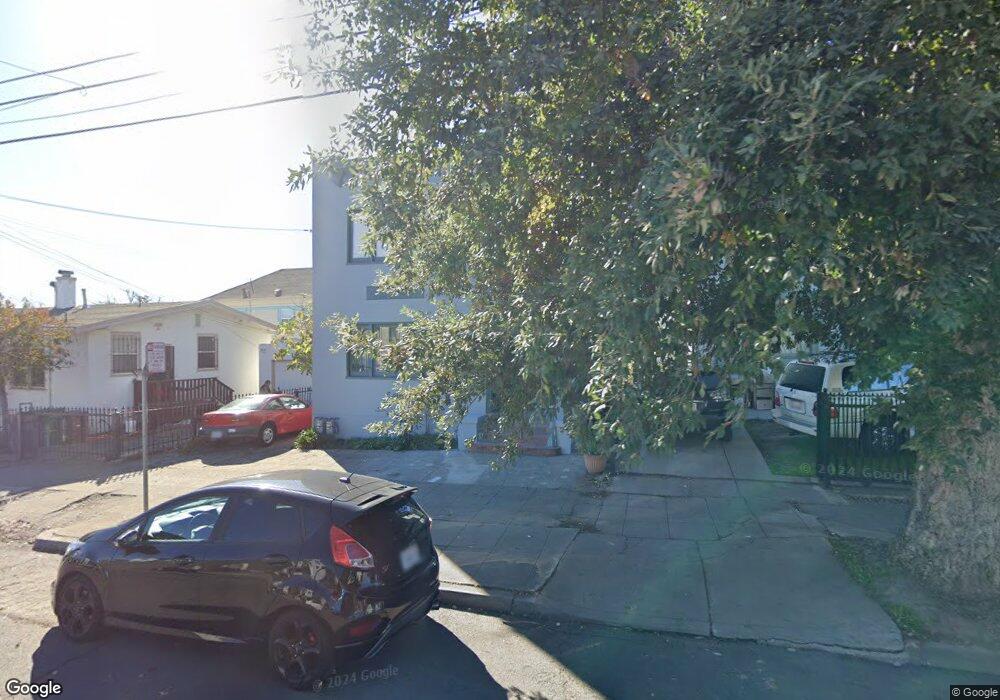
2425 E 20th St Oakland, CA 94601
Meadow Brook NeighborhoodEstimated Value: $516,000 - $639,099
2
Beds
2
Baths
1,714
Sq Ft
$327/Sq Ft
Est. Value
About This Home
This home is located at 2425 E 20th St, Oakland, CA 94601 and is currently estimated at $560,025, approximately $326 per square foot. 2425 E 20th St is a home located in Alameda County with nearby schools including Garfield Elementary School, Roosevelt Middle School, and Fremont High School.
Ownership History
Date
Name
Owned For
Owner Type
Purchase Details
Closed on
Jan 9, 2020
Sold by
Chambers Kathryn J and Katheryn J Chambers Trust
Bought by
Brooks Nathaniel V and Loring Jack
Current Estimated Value
Home Financials for this Owner
Home Financials are based on the most recent Mortgage that was taken out on this home.
Original Mortgage
$436,262
Interest Rate
3.6%
Mortgage Type
New Conventional
Purchase Details
Closed on
Dec 16, 2015
Sold by
Chambers Bruce R and Chambers Kathryn J
Bought by
Chambers Bruce R and Kathryn J Chambers Trust
Purchase Details
Closed on
May 1, 2006
Sold by
Wade Patricia and Patricia Wade Trust
Bought by
Chambers Bruce R and Chambers Kathryn J
Purchase Details
Closed on
Aug 21, 2001
Sold by
Wade Patricia
Bought by
Wade Patricia and Patricia Wade Trust
Create a Home Valuation Report for This Property
The Home Valuation Report is an in-depth analysis detailing your home's value as well as a comparison with similar homes in the area
Home Values in the Area
Average Home Value in this Area
Purchase History
| Date | Buyer | Sale Price | Title Company |
|---|---|---|---|
| Brooks Nathaniel V | $513,500 | Chicago Title Company | |
| Chambers Bruce R | -- | None Available | |
| Chambers Bruce R | -- | North American Title Co | |
| Wade Patricia | -- | -- |
Source: Public Records
Mortgage History
| Date | Status | Borrower | Loan Amount |
|---|---|---|---|
| Open | Brooks Nathaniel V | $84,000 | |
| Open | Brooks Nathaniel V | $447,600 | |
| Closed | Brooks Nathaniel V | $436,262 | |
| Previous Owner | Chambers Bruce R | $105,000 | |
| Previous Owner | Chambers Bruce R | $60,000 |
Source: Public Records
Tax History Compared to Growth
Tax History
| Year | Tax Paid | Tax Assessment Tax Assessment Total Assessment is a certain percentage of the fair market value that is determined by local assessors to be the total taxable value of land and additions on the property. | Land | Improvement |
|---|---|---|---|---|
| 2025 | $9,202 | $554,250 | $168,309 | $392,941 |
| 2024 | $9,202 | $543,247 | $165,010 | $385,237 |
| 2023 | $9,592 | $539,460 | $161,775 | $377,685 |
| 2022 | $9,254 | $521,883 | $158,603 | $370,280 |
| 2021 | $8,752 | $511,516 | $155,494 | $363,022 |
| 2020 | $7,308 | $408,204 | $122,504 | $285,700 |
| 2019 | $6,953 | $400,203 | $120,103 | $280,100 |
| 2018 | $6,811 | $392,357 | $117,748 | $274,609 |
| 2017 | $6,518 | $384,667 | $115,440 | $269,227 |
| 2016 | $6,276 | $377,126 | $113,177 | $263,949 |
| 2015 | $5,812 | $340,000 | $102,000 | $238,000 |
| 2014 | $5,589 | $310,000 | $93,000 | $217,000 |
Source: Public Records
Map
Nearby Homes
- 2510 E 21st St
- 2017 27th Ave
- 2021 27th Ave
- 2340 E 21st St
- 2401 Foothill Blvd
- 2004 27th Ave
- 2373 Foothill Blvd
- 2227 25th Ave
- 2538 E 16th St Unit 1
- 2222 Inyo Ave
- 1607 Miller Ave
- 2140 27th Ave
- 2304 E 22nd St
- 2222 23rd Ave
- 2775 E 21st St
- 1729 28th Ave
- 2230 23rd Ave
- 2246 23rd Ave
- 2207 E 21st St
- 2207 E 19th St