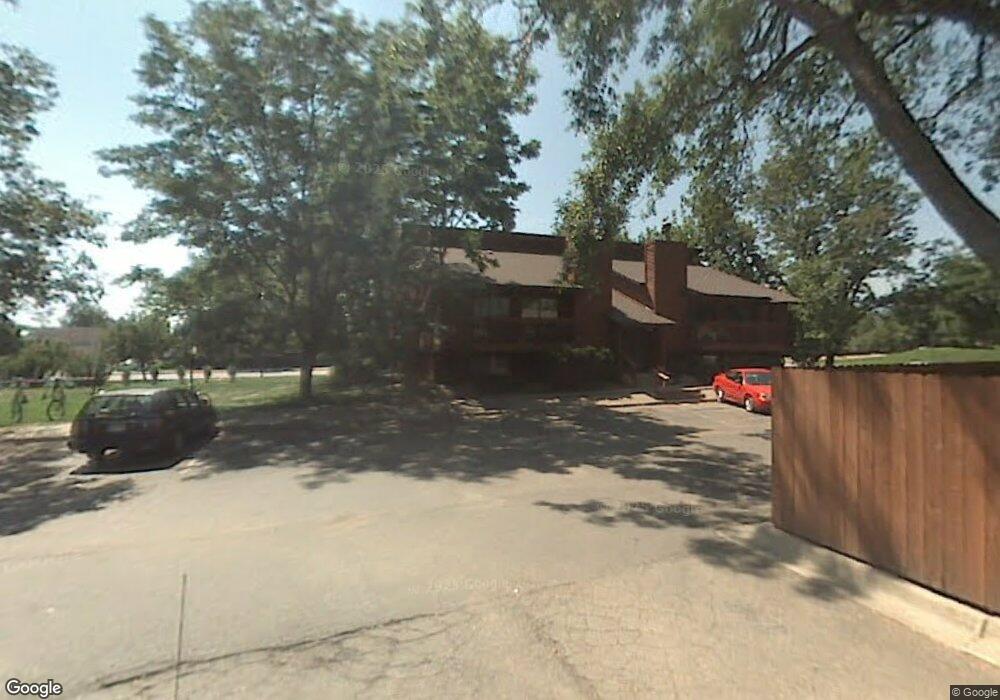
2606 Juniper Ave Unit 345 Boulder, CO 80304
North Boulder NeighborhoodEstimated Value: $277,000 - $324,000
1
Bed
1
Bath
548
Sq Ft
$550/Sq Ft
Est. Value
About This Home
This home is located at 2606 Juniper Ave Unit 345, Boulder, CO 80304 and is currently estimated at $301,559, approximately $550 per square foot. 2606 Juniper Ave Unit 345 is a home located in Boulder County with nearby schools including Columbine Elementary School, Centennial Middle School, and Boulder High School.
Ownership History
Date
Name
Owned For
Owner Type
Purchase Details
Closed on
Mar 28, 2002
Sold by
Shea Kerry W and Shea William F
Bought by
Benjamin Joseph
Current Estimated Value
Home Financials for this Owner
Home Financials are based on the most recent Mortgage that was taken out on this home.
Original Mortgage
$94,400
Outstanding Balance
$38,025
Interest Rate
6.01%
Mortgage Type
Negative Amortization
Estimated Equity
$264,021
Purchase Details
Closed on
Aug 25, 1998
Sold by
Shea Kerry W and Herman Susan Ann
Bought by
Shea Kerry W and Shea William F
Purchase Details
Closed on
Jul 10, 1996
Sold by
Theisen Carol A and Sugarloaf Properties
Bought by
Shea Kerry W
Home Financials for this Owner
Home Financials are based on the most recent Mortgage that was taken out on this home.
Original Mortgage
$54,400
Interest Rate
8.05%
Purchase Details
Closed on
Jul 31, 1992
Bought by
Benjamin Joseph
Purchase Details
Closed on
May 10, 1979
Bought by
Benjamin Joseph
Create a Home Valuation Report for This Property
The Home Valuation Report is an in-depth analysis detailing your home's value as well as a comparison with similar homes in the area
Home Values in the Area
Average Home Value in this Area
Purchase History
| Date | Buyer | Sale Price | Title Company |
|---|---|---|---|
| Benjamin Joseph | $118,000 | -- | |
| Shea Kerry W | -- | -- | |
| Shea Kerry W | $68,000 | -- | |
| Benjamin Joseph | $35,400 | -- | |
| Benjamin Joseph | $42,000 | -- |
Source: Public Records
Mortgage History
| Date | Status | Borrower | Loan Amount |
|---|---|---|---|
| Open | Benjamin Joseph | $94,400 | |
| Previous Owner | Shea Kerry W | $54,400 |
Source: Public Records
Tax History Compared to Growth
Tax History
| Year | Tax Paid | Tax Assessment Tax Assessment Total Assessment is a certain percentage of the fair market value that is determined by local assessors to be the total taxable value of land and additions on the property. | Land | Improvement |
|---|---|---|---|---|
| 2025 | $1,463 | $18,588 | -- | $18,588 |
| 2024 | $1,463 | $18,588 | -- | $18,588 |
| 2023 | $1,435 | $15,749 | -- | $19,434 |
| 2022 | $1,601 | $16,430 | $0 | $16,430 |
| 2021 | $1,530 | $16,903 | $0 | $16,903 |
| 2020 | $1,454 | $16,702 | $0 | $16,702 |
| 2019 | $1,432 | $16,702 | $0 | $16,702 |
| 2018 | $1,325 | $15,278 | $0 | $15,278 |
| 2017 | $1,283 | $16,891 | $0 | $16,891 |
| 2016 | $1,052 | $12,155 | $0 | $12,155 |
| 2015 | $996 | $10,300 | $0 | $10,300 |
| 2014 | $866 | $10,300 | $0 | $10,300 |
Source: Public Records
Map
Nearby Homes
- 2636 Juniper Ave Unit 391
- 2636 Juniper Ave Unit 1
- 2617 Juniper Ave
- 2602 Tumwater Ln
- 2652 Sherwood Cir
- 2725 Juniper Ave Unit 78
- 3515 28th St Unit 105
- 3515 28th St Unit 108
- 3535 28th St Unit 202
- 3525 28th St Unit 304
- 2595 Glenwood Dr
- 2800 Kalmia Ave Unit A220
- 2800 Kalmia Ave Unit C205
- 2800 Kalmia Ave Unit A107
- 2800 Kalmia Ave Unit C101
- 3675 Roundtree Ct
- 3119 Westwood Ct
- 2025 Grape Ave
- 3737 26th St
- 2672 Winding Trail Dr
- 2606 Juniper Ave Unit 348
- 2606 Juniper Ave Unit 347
- 2606 Juniper Ave Unit 346
- 2606 Juniper Ave Unit 344
- 2606 Juniper Ave Unit 343
- 2606 Juniper Ave Unit 342
- 2606 Juniper Ave Unit 341
- 2606 Juniper Ave Unit 7
- 2606 Juniper Ave
- 2606 Juniper Ave Unit 4
- 2606 Juniper Ave Unit 8
- 2606 Juniper Ave Unit 6
- 2606 Juniper Ave Unit 3
- 3434 26th St
- 2636 Juniper Ave Unit 393
- 2636 Juniper Ave Unit 397
- 2636 Juniper Ave Unit 398
- 2636 Juniper Ave Unit 394
- 2636 Juniper Ave Unit 395
- 2640 Juniper Ave Unit 388