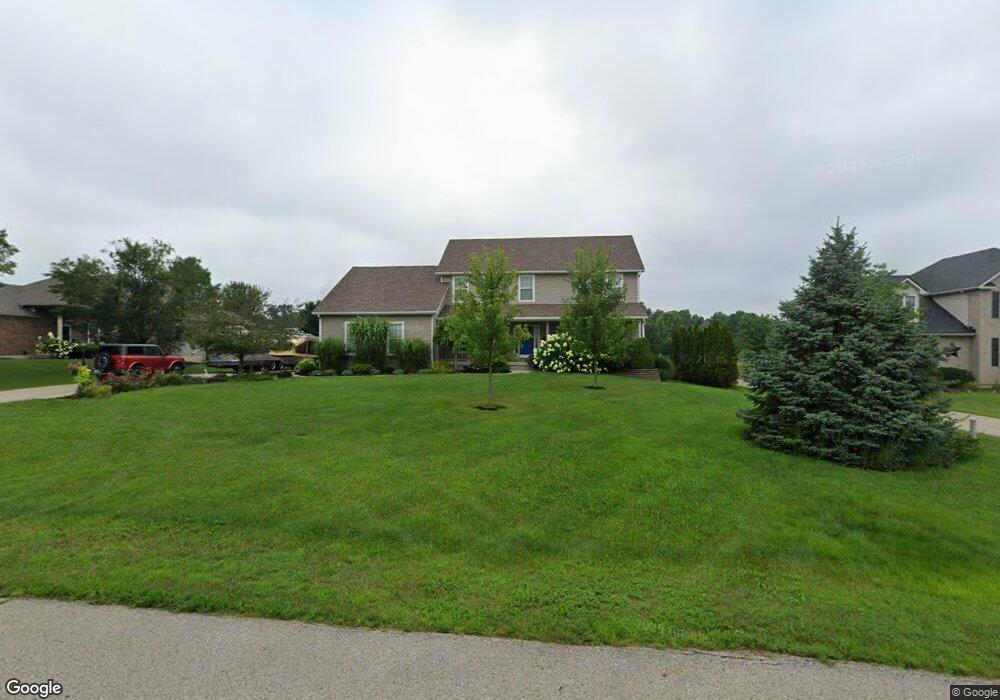
2906 Station House Way Waynesville, OH 45068
Clearcreek Township NeighborhoodEstimated Value: $616,000 - $715,000
4
Beds
3
Baths
2,860
Sq Ft
$233/Sq Ft
Est. Value
About This Home
This home is located at 2906 Station House Way, Waynesville, OH 45068 and is currently estimated at $665,800, approximately $232 per square foot. 2906 Station House Way is a home located in Warren County with nearby schools including Clearcreek Elementary School, Springboro Intermediate School, and Springboro Junior High School.
Ownership History
Date
Name
Owned For
Owner Type
Purchase Details
Closed on
Sep 8, 2006
Sold by
Associated Construction Enterprises Inc
Bought by
Speitel Eric D and Speitel Lisa A
Current Estimated Value
Home Financials for this Owner
Home Financials are based on the most recent Mortgage that was taken out on this home.
Original Mortgage
$250,000
Interest Rate
6.7%
Mortgage Type
Purchase Money Mortgage
Purchase Details
Closed on
Mar 10, 2006
Sold by
Springboro Station Llc
Bought by
Associated Construction Enterprises Inc
Home Financials for this Owner
Home Financials are based on the most recent Mortgage that was taken out on this home.
Original Mortgage
$242,000
Interest Rate
6.38%
Mortgage Type
Purchase Money Mortgage
Create a Home Valuation Report for This Property
The Home Valuation Report is an in-depth analysis detailing your home's value as well as a comparison with similar homes in the area
Home Values in the Area
Average Home Value in this Area
Purchase History
| Date | Buyer | Sale Price | Title Company |
|---|---|---|---|
| Speitel Eric D | $326,500 | Talon Group | |
| Associated Construction Enterprises Inc | $60,000 | The Talon Group |
Source: Public Records
Mortgage History
| Date | Status | Borrower | Loan Amount |
|---|---|---|---|
| Open | Speitel Eric D | $235,425 | |
| Closed | Speitel Eric D | $248,400 | |
| Closed | Speitel Eric D | $250,000 | |
| Previous Owner | Associated Construction Enterprises Inc | $242,000 |
Source: Public Records
Tax History Compared to Growth
Tax History
| Year | Tax Paid | Tax Assessment Tax Assessment Total Assessment is a certain percentage of the fair market value that is determined by local assessors to be the total taxable value of land and additions on the property. | Land | Improvement |
|---|---|---|---|---|
| 2024 | $6,881 | $168,900 | $36,070 | $132,830 |
| 2023 | $5,979 | $134,694 | $21,913 | $112,780 |
| 2022 | $5,848 | $134,694 | $21,914 | $112,781 |
| 2021 | $5,502 | $134,694 | $21,914 | $112,781 |
| 2020 | $5,390 | $114,149 | $18,571 | $95,578 |
| 2019 | $4,994 | $114,149 | $18,571 | $95,578 |
| 2018 | $4,987 | $114,149 | $18,571 | $95,578 |
| 2017 | $4,970 | $102,225 | $17,336 | $84,889 |
| 2016 | $5,172 | $102,225 | $17,336 | $84,889 |
| 2015 | $4,771 | $102,225 | $17,336 | $84,889 |
| 2014 | $4,771 | $89,010 | $15,190 | $73,820 |
| 2013 | $4,769 | $108,740 | $18,390 | $90,350 |
Source: Public Records
Map
Nearby Homes
- 7476 Waterway Dr
- 7248 Sheffield Way
- 1744 Harlan Rd
- 9475 Whispering Stream Ct
- 3950 E State Route 73
- Versailles Estate Plan at Copper Mill
- Corsica Estate Plan at Copper Mill
- Cumberland Estate Plan at Copper Mill
- Normandy Estate Plan at Copper Mill
- Saint Lawrence Estate Plan at Copper Mill
- 1741 Wandering Stream Way
- 9633 Linden Brook Dr
- 8590 Shelly Woods Ct
- 7510 Country Brook Ct
- 0 White Cedar Way Unit 1818661
- 6803 St Rt 48 N
- 6803 E State Route 48
- 2225 Cold Stream Dr
- 2246 Cold Stream Dr
- Ballenger Plan at Winding Creek
- 2900 Station House Way
- 2912 Station House Way
- 2894 Station House Way
- 2916 Station House Way
- 2922 Station House Way
- 2888 Station House Way
- 2888 Station House Dr
- 1 Station House Way
- 2800 Station House Way
- 2665 Lucy Ln
- 2907 Station House Way
- 2901 Station House Way
- 2913 Station House Way
- 2882 Station House Way
- 2895 Station House Way
- 2928 Station House Way
- 2919 Station House Way
- 2613 Lucy Ln
- 2889 Station House Way
- 2723 Lucy Ln