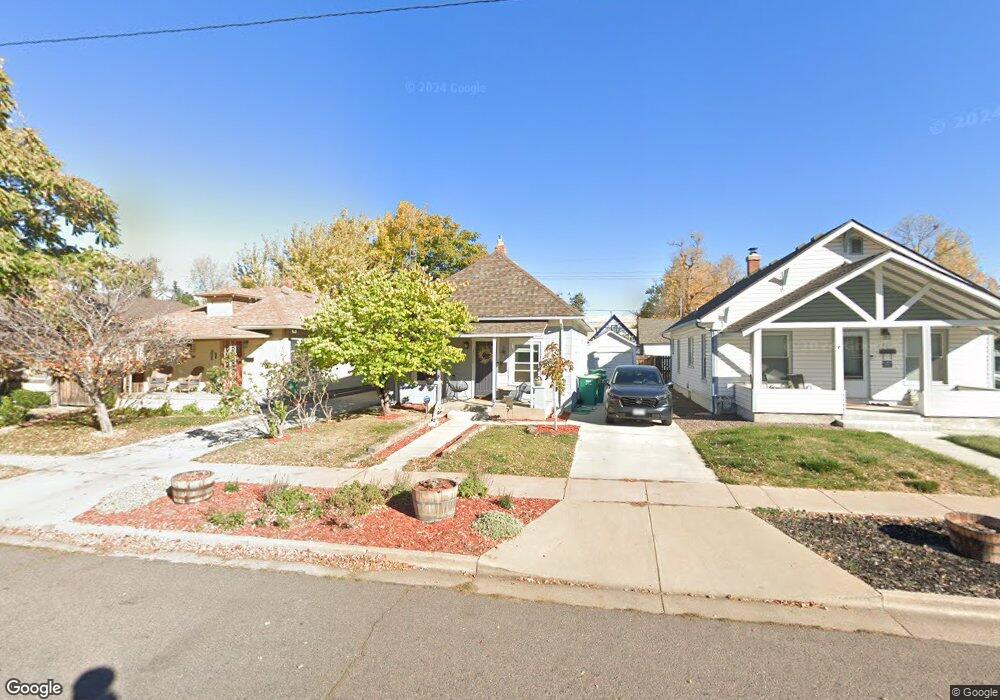
2956 S Bannock St Englewood, CO 80110
Cushing Park NeighborhoodEstimated Value: $444,000 - $462,909
2
Beds
1
Bath
836
Sq Ft
$545/Sq Ft
Est. Value
About This Home
This home is located at 2956 S Bannock St, Englewood, CO 80110 and is currently estimated at $455,477, approximately $544 per square foot. 2956 S Bannock St is a home located in Arapahoe County with nearby schools including Bishop Elementary School, Englewood Middle School, and Englewood High School.
Ownership History
Date
Name
Owned For
Owner Type
Purchase Details
Closed on
Jun 30, 2021
Sold by
Flynn Christopher A and Flynn Stacie W
Bought by
Grandis Colleen
Current Estimated Value
Home Financials for this Owner
Home Financials are based on the most recent Mortgage that was taken out on this home.
Original Mortgage
$413,250
Outstanding Balance
$379,001
Interest Rate
2.9%
Mortgage Type
New Conventional
Estimated Equity
$80,626
Purchase Details
Closed on
Oct 16, 2013
Sold by
Jones Christopher R
Bought by
Flynn Christopher A and Flynn Stacie W
Home Financials for this Owner
Home Financials are based on the most recent Mortgage that was taken out on this home.
Original Mortgage
$206,196
Interest Rate
4.75%
Mortgage Type
FHA
Purchase Details
Closed on
Jul 12, 2004
Sold by
Learmann Kevin
Bought by
Jones Christopher R
Home Financials for this Owner
Home Financials are based on the most recent Mortgage that was taken out on this home.
Original Mortgage
$130,400
Interest Rate
4.87%
Mortgage Type
Purchase Money Mortgage
Purchase Details
Closed on
Dec 13, 1993
Sold by
Jacobsen William Charles
Bought by
Learmann Kevin
Home Financials for this Owner
Home Financials are based on the most recent Mortgage that was taken out on this home.
Original Mortgage
$47,071
Interest Rate
7.19%
Mortgage Type
FHA
Purchase Details
Closed on
Jul 25, 1990
Sold by
Conversion Arapco
Bought by
Jacobsen William Charles
Purchase Details
Closed on
Jul 4, 1776
Bought by
Conversion Arapco
Create a Home Valuation Report for This Property
The Home Valuation Report is an in-depth analysis detailing your home's value as well as a comparison with similar homes in the area
Home Values in the Area
Average Home Value in this Area
Purchase History
| Date | Buyer | Sale Price | Title Company |
|---|---|---|---|
| Grandis Colleen | $435,000 | Land Title Guarantee Company | |
| Flynn Christopher A | $210,000 | Fidelity National Title Insu | |
| Jones Christopher R | $163,000 | Chicago Title Co | |
| Learmann Kevin | $46,000 | Title America | |
| Jacobsen William Charles | -- | -- | |
| Conversion Arapco | -- | -- |
Source: Public Records
Mortgage History
| Date | Status | Borrower | Loan Amount |
|---|---|---|---|
| Open | Grandis Colleen | $413,250 | |
| Previous Owner | Flynn Stacie W | $279,200 | |
| Previous Owner | Flynn Christopher A | $277,500 | |
| Previous Owner | Flynn Christopher A | $57,886 | |
| Previous Owner | Flynn Christopher A | $44,500 | |
| Previous Owner | Flynn Stacie W | $212,000 | |
| Previous Owner | Flynn Christopher A | $206,196 | |
| Previous Owner | Jones Christopher R | $142,500 | |
| Previous Owner | Jones Christopher R | $145,600 | |
| Previous Owner | Jones Christopher R | $31,800 | |
| Previous Owner | Jones Christopher R | $37,200 | |
| Previous Owner | Jones Christopher R | $3,864 | |
| Previous Owner | Jones Christopher R | $130,400 | |
| Previous Owner | Learmann Kevin | $50,000 | |
| Previous Owner | Learmann Kevin | $89,000 | |
| Previous Owner | Learmann Kevin | $15,000 | |
| Previous Owner | Learmann Kevin | $47,071 | |
| Closed | Jones Christopher R | $32,600 |
Source: Public Records
Tax History Compared to Growth
Tax History
| Year | Tax Paid | Tax Assessment Tax Assessment Total Assessment is a certain percentage of the fair market value that is determined by local assessors to be the total taxable value of land and additions on the property. | Land | Improvement |
|---|---|---|---|---|
| 2024 | $2,144 | $30,478 | -- | -- |
| 2023 | $2,144 | $30,478 | $0 | $0 |
| 2022 | $1,934 | $26,556 | $0 | $0 |
| 2021 | $1,927 | $26,556 | $0 | $0 |
| 2020 | $2,056 | $27,992 | $0 | $0 |
| 2019 | $2,043 | $27,992 | $0 | $0 |
| 2018 | $1,680 | $21,485 | $0 | $0 |
| 2017 | $1,446 | $18,655 | $0 | $0 |
| 2016 | $1,289 | $15,753 | $0 | $0 |
| 2015 | $1,064 | $15,753 | $0 | $0 |
| 2014 | -- | $12,283 | $0 | $0 |
| 2013 | -- | $12,170 | $0 | $0 |
Source: Public Records
Map
Nearby Homes
- 2995 S Bannock St
- 2926 S Cherokee St
- 2961 S Cherokee St
- 2874 S Bannock St
- 2891 S Cherokee St
- 3047 S Cherokee St
- 2959 S Delaware St
- 2858 S Delaware St
- 2956 S Elati St
- 2801 S Bannock St
- 2935 S Sherman St
- 3103 S Cherokee St
- 3042 S Lincoln St
- 2835 S Elati St
- 2990 S Sherman St
- 3069 S Elati St
- 2898 S Sherman St
- 3024 S Sherman St
- 3174 S Cherokee St
- 3129 S Sherman St
- 2950 S Bannock St
- 2960 S Bannock St
- 2946 S Bannock St
- 2980 S Bannock St
- 2984 S Bannock St
- 2961 S Acoma St
- 2959 S Acoma St
- 2965 S Acoma St
- 2943 S Acoma St
- 2990 S Bannock St
- 2988 S Bannock St
- 2939 S Acoma St
- 2967 S Acoma St
- 2961 S Bannock St
- 2957 S Bannock St
- 2928 S Bannock St
- 2965 S Bannock St
- 2941 S Bannock St
- 2935 S Acoma St
- 2998 S Bannock St