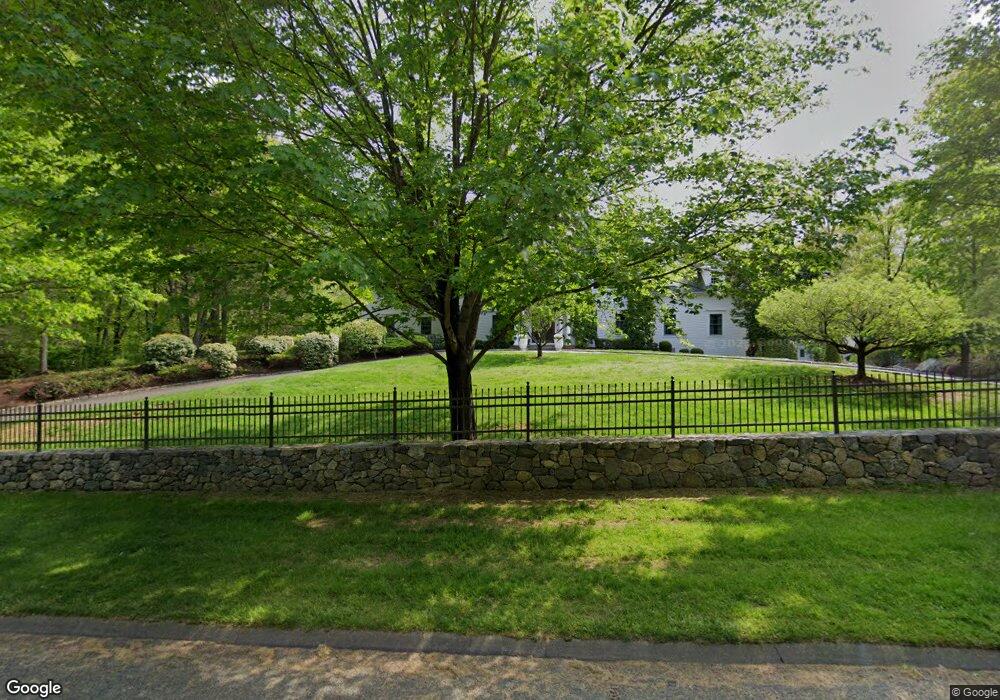
3 Canterbury Ln Easton, CT 06612
Estimated Value: $889,000 - $1,801,141
7
Beds
7
Baths
6,140
Sq Ft
$224/Sq Ft
Est. Value
About This Home
This home is located at 3 Canterbury Ln, Easton, CT 06612 and is currently estimated at $1,373,535, approximately $223 per square foot. 3 Canterbury Ln is a home located in Fairfield County with nearby schools including Samuel Staples Elementary School, Helen Keller Middle School, and Joel Barlow High School.
Ownership History
Date
Name
Owned For
Owner Type
Purchase Details
Closed on
Sep 10, 2024
Sold by
Huribal Marsel
Bought by
Huribal Mary C
Current Estimated Value
Purchase Details
Closed on
Oct 3, 2012
Sold by
Huribal Marsel
Bought by
Highland Place Llc
Purchase Details
Closed on
Aug 13, 2012
Sold by
Huribal Marsel
Bought by
Huribal Marsel and Huribal Mary C
Purchase Details
Closed on
Dec 28, 1999
Sold by
Kimball Constr Group
Bought by
Huribal Marsel and Huribal Mary C
Purchase Details
Closed on
Feb 20, 1998
Sold by
Hellrigel John P and Hellrigel Reletta
Bought by
Kimball Constr Group
Create a Home Valuation Report for This Property
The Home Valuation Report is an in-depth analysis detailing your home's value as well as a comparison with similar homes in the area
Home Values in the Area
Average Home Value in this Area
Purchase History
| Date | Buyer | Sale Price | Title Company |
|---|---|---|---|
| Huribal Mary C | -- | None Available | |
| Huribal Mary C | -- | None Available | |
| Huribal Mary C | -- | None Available | |
| Highland Place Llc | -- | -- | |
| Huribal Marsel | $470,000 | -- | |
| Huribal Marsel | -- | -- | |
| Huribal Marsel | $775,000 | -- | |
| Kimball Constr Group | $250,000 | -- | |
| Highland Place Llc | -- | -- | |
| Huribal Marsel | -- | -- | |
| Huribal Marsel | $775,000 | -- | |
| Kimball Constr Group | $250,000 | -- |
Source: Public Records
Mortgage History
| Date | Status | Borrower | Loan Amount |
|---|---|---|---|
| Previous Owner | Kimball Constr Group | $700,000 | |
| Previous Owner | Kimball Constr Group | $750,000 |
Source: Public Records
Tax History Compared to Growth
Tax History
| Year | Tax Paid | Tax Assessment Tax Assessment Total Assessment is a certain percentage of the fair market value that is determined by local assessors to be the total taxable value of land and additions on the property. | Land | Improvement |
|---|---|---|---|---|
| 2025 | $34,972 | $1,128,120 | $196,280 | $931,840 |
| 2024 | $33,325 | $1,128,120 | $196,280 | $931,840 |
| 2023 | $32,670 | $1,128,120 | $196,280 | $931,840 |
| 2022 | $32,084 | $1,128,120 | $196,280 | $931,840 |
| 2021 | $29,688 | $917,700 | $210,280 | $707,420 |
| 2020 | $28,449 | $917,700 | $210,280 | $707,420 |
| 2019 | $28,752 | $917,700 | $210,280 | $707,420 |
| 2018 | $28,797 | $917,700 | $210,280 | $707,420 |
| 2017 | $30,633 | $917,700 | $210,280 | $707,420 |
| 2016 | $28,314 | $918,990 | $245,350 | $673,640 |
| 2015 | $27,919 | $918,990 | $245,350 | $673,640 |
| 2014 | $27,478 | $918,990 | $245,350 | $673,640 |
Source: Public Records
Map
Nearby Homes
- 82 Rock House Rd
- 235 Rock House Rd
- 110 Sturbridge Ln
- 27 W Woodland Dr
- 5288 Madison Ave
- 294 Maple Rd
- 33 Patmar Dr
- 37 Kent Ln
- 35 Red Barn Rd
- 60 Red Barn Rd
- 897 Sport Hill Rd
- 78 Old Tree Farm Ln
- 52 Autumn Dr
- 34 Easton Rd
- 24 Maple Terrace
- 103 Deepwood Rd
- 271 Hattertown Rd
- 26 Freedman Ln
- 49 Quarter Horse Dr
- 85 Westport Rd
- 3 Canterbury Ln
- 4 Canterbury Ln
- 12 Canterbury Ln
- 325 Everett Rd
- 385 Stepney Rd
- 7 Canterbury Ln
- 320 Everett Rd
- 16 Canterbury Ln
- 289 Everett Rd
- 8 Canterbury Ln
- 100 Crossbow Ln
- 11 Canterbury Ln
- 375 Stepney Rd
- 312 Everett Rd
- 17 Crossbow Ln
- 360 Stepney Rd
- 20 Canterbury Ln
- 90 Crossbow Ln
- 30 Sherwood Dr
- 115 Judd Rd