Estimated payment $1,223/month
About This Home
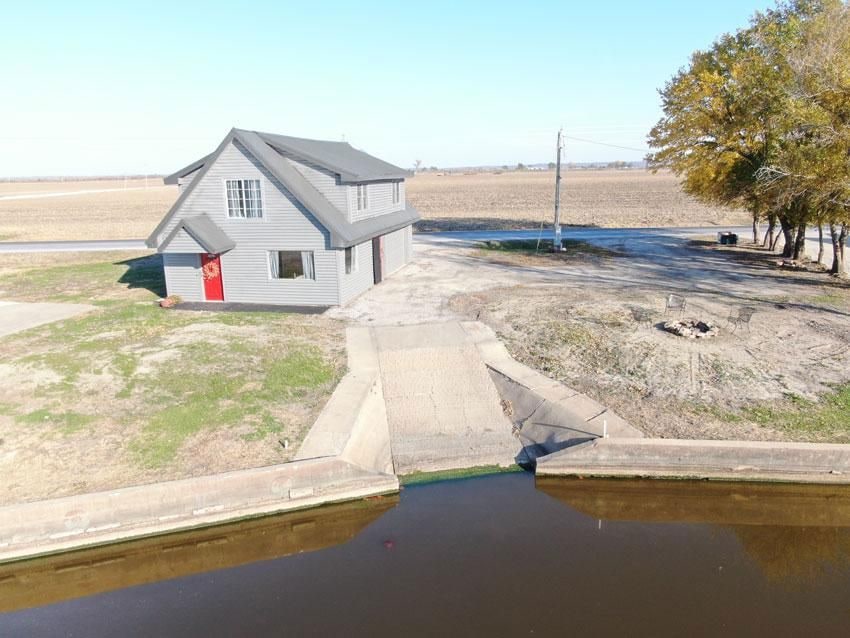
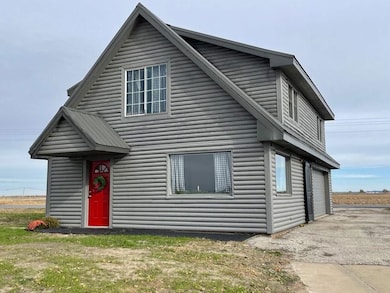
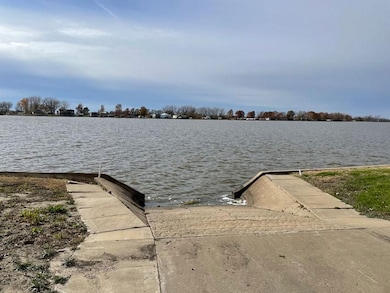
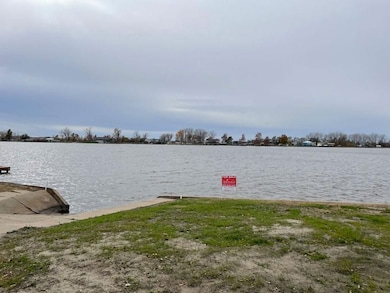
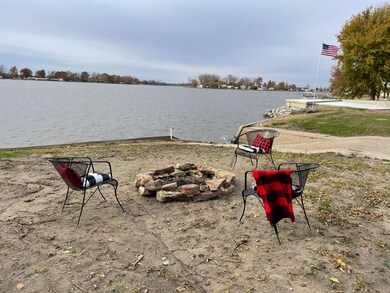
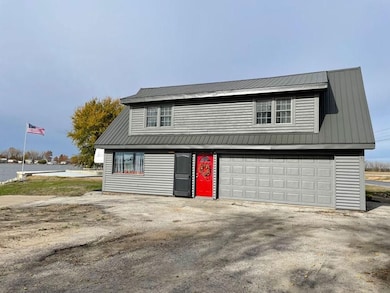
Here is a nice, 2-story log sided cabin on TWO lakefront lots that is completely remodeled (includes HVAC & plumbing). Highway access, prime central lake location with good water depth, & a private concrete boat ramp! Upper level consists of 1-2 bedrooms as one bedroom can function as an upper level living room. Lower level consists of a lake-side family room, bath with an all-tile massage shower, additional laundry hookups and a 2-car garage with concrete floor! Great investment opportunity at this low price!!
# Bedrooms:
2
# Baths:
1 1/2
Lot size:
Approx. 120' X 155'
School District:
Craig R-III
Taxes:
2022 taxes were $523.96
Sewer:
Septic tank
Exterior:
Wood log siding/metal roof
Water:
City
Other Features:
Hwy access-NO GRAVEL!
Concrete Seawall
Private concrete boat ramp
Asphalt private circle driveway
Walking distance from Big Lake State Park
Walking distance from public swimming pool
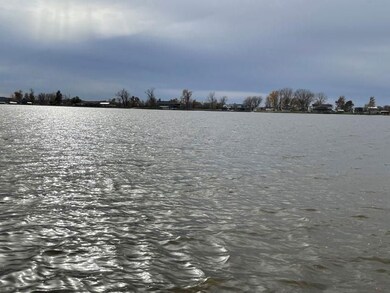
Beautiful wide main lake view!
Good water depth

Home Details
Home Type
- Single Family
Est. Annual Taxes
- $514
Bedrooms and Bathrooms
- 2 Bedrooms
Map
Home Values in the Area
Average Home Value in this Area
Tax History
| Year | Tax Paid | Tax Assessment Tax Assessment Total Assessment is a certain percentage of the fair market value that is determined by local assessors to be the total taxable value of land and additions on the property. | Land | Improvement |
|---|---|---|---|---|
| 2024 | $514 | $7,460 | $0 | $0 |
| 2023 | $513 | $7,460 | $0 | $0 |
| 2022 | $524 | $7,440 | $0 | $0 |
| 2021 | $436 | $6,140 | $0 | $0 |
| 2020 | $442 | $6,140 | $0 | $0 |
| 2019 | $442 | $6,300 | $6,300 | $0 |
| 2018 | $433 | $6,220 | $6,220 | $0 |
| 2017 | $440 | $6,220 | $6,220 | $0 |
| 2016 | -- | $6,210 | $6,210 | $0 |
| 2013 | -- | $3,460 | $3,460 | $0 |
| 2012 | -- | $3,530 | $0 | $0 |
Property History
| Date | Event | Price | List to Sale | Price per Sq Ft | Prior Sale |
|---|---|---|---|---|---|
| 07/28/2025 07/28/25 | Price Changed | $225,000 | 0.0% | -- | |
| 07/28/2025 07/28/25 | Price Changed | $225,000 | +15.4% | -- | |
| 05/23/2025 05/23/25 | For Sale | $195,000 | 0.0% | -- | |
| 03/06/2025 03/06/25 | Off Market | -- | -- | -- | |
| 10/17/2024 10/17/24 | Price Changed | $195,000 | -13.3% | -- | |
| 08/26/2024 08/26/24 | Price Changed | $225,000 | +11.1% | -- | |
| 06/11/2024 06/11/24 | Price Changed | $202,500 | -10.0% | -- | |
| 05/03/2023 05/03/23 | Price Changed | $225,000 | -9.6% | -- | |
| 11/22/2022 11/22/22 | Price Changed | $249,000 | +47.3% | -- | |
| 10/31/2022 10/31/22 | Price Changed | $169,000 | -13.3% | -- | |
| 09/09/2022 09/09/22 | For Sale | $195,000 | +69.6% | -- | |
| 03/04/2020 03/04/20 | For Sale | $115,000 | +43.8% | -- | |
| 07/18/2018 07/18/18 | Sold | -- | -- | -- | View Prior Sale |
| 07/02/2018 07/02/18 | Pending | -- | -- | -- | |
| 06/28/2018 06/28/18 | For Sale | $79,950 | -- | -- |
Purchase History
| Date | Type | Sale Price | Title Company |
|---|---|---|---|
| Deed | -- | -- |
- 0 Danbury Rd
- 197 Lindamood Rd
- 112 Richards Ln
- 405 Fairlane Dr
- 274 Alpine Beach N A
- 345 Mallard Ln
- 493 Lake Shore Dr
- 341 Mallard Ln
- 103 Ruwwe Dr
- 517 Lake Shore Dr
- 23254 Fox Rd
- 243 Mallard Ln
- 239 Mallard Ln
- 1 Danbury Rd
- 242 Ramsey Dr
- 114 Mobile Ln
- 110 Mobile Ln
- 150 Ramsey Dr
- 140 W Fields Shady Rest N A
- 1 Holt 240