Estimated Value: $236,000 - $361,000
2
Beds
1
Bath
916
Sq Ft
$305/Sq Ft
Est. Value
About This Home
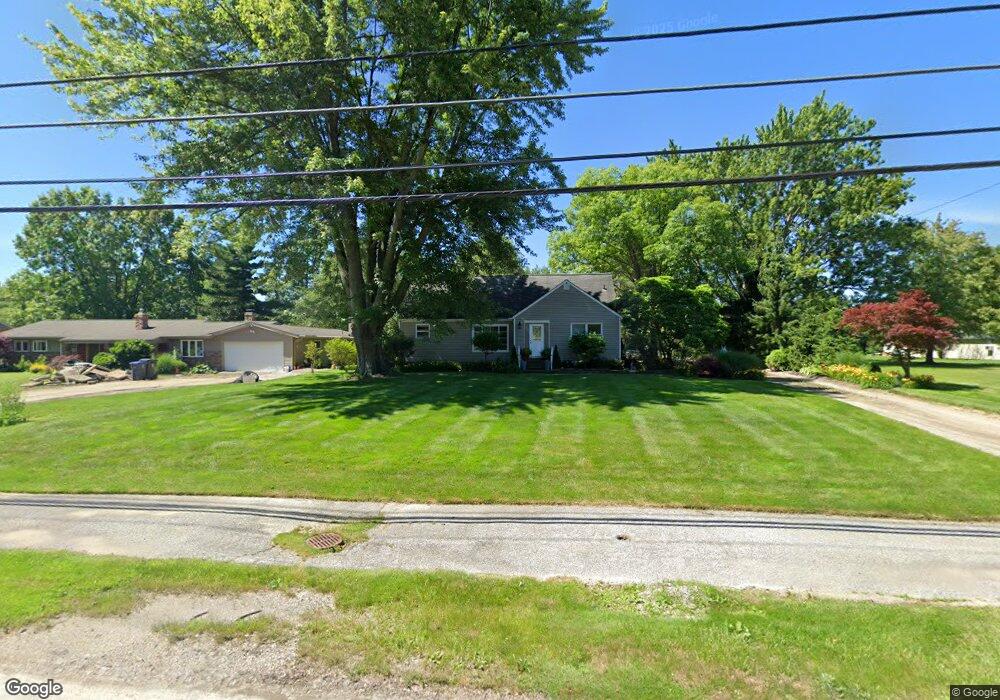
This home is located at 35450 Aurora Rd, Solon, OH 44139 and is currently estimated at $279,476, approximately $305 per square foot. 35450 Aurora Rd is a home located in Cuyahoga County with nearby schools including Orchard Middle School, Parkside Elementary School, and Solon Middle School.
Ownership History
Date
Name
Owned For
Owner Type
Purchase Details
Closed on
Sep 2, 2021
Sold by
Chavez Jose L
Bought by
City Of Solon
Current Estimated Value
Purchase Details
Closed on
Jul 25, 2001
Sold by
Downing Curtis J Lundstrom Carol Ann and Lundstrom Roy A
Bought by
Chavez Jose L
Home Financials for this Owner
Home Financials are based on the most recent Mortgage that was taken out on this home.
Original Mortgage
$130,173
Interest Rate
7.28%
Mortgage Type
FHA
Purchase Details
Closed on
Aug 20, 1998
Sold by
Downing Mildred A
Bought by
Downing Curtis J and Lundstrom Carol Ann
Purchase Details
Closed on
Jan 11, 1985
Sold by
Downing Curtis J
Bought by
Downing Mildred A
Purchase Details
Closed on
Jun 26, 1981
Sold by
Downing Curtis J
Bought by
Downing Curtis J
Purchase Details
Closed on
Jan 1, 1975
Bought by
Downing Curtis J
Create a Home Valuation Report for This Property
The Home Valuation Report is an in-depth analysis detailing your home's value as well as a comparison with similar homes in the area
Home Values in the Area
Average Home Value in this Area
Purchase History
| Date | Buyer | Sale Price | Title Company |
|---|---|---|---|
| City Of Solon | $21,100 | None Available | |
| Chavez Jose L | $135,000 | Midland Title Security Inc | |
| Downing Curtis J | -- | -- | |
| Downing Mildred A | -- | -- | |
| Downing Curtis J | -- | -- | |
| Downing Curtis J | -- | -- |
Source: Public Records
Mortgage History
| Date | Status | Borrower | Loan Amount |
|---|---|---|---|
| Previous Owner | Chavez Jose L | $190,000 | |
| Previous Owner | Chavez Jose L | $160,000 | |
| Previous Owner | Chavez Jose L | $130,173 |
Source: Public Records
Tax History Compared to Growth
Tax History
| Year | Tax Paid | Tax Assessment Tax Assessment Total Assessment is a certain percentage of the fair market value that is determined by local assessors to be the total taxable value of land and additions on the property. | Land | Improvement |
|---|---|---|---|---|
| 2024 | $4,453 | $81,375 | $20,195 | $61,180 |
| 2023 | $3,806 | $56,880 | $15,440 | $41,440 |
| 2022 | $3,798 | $56,880 | $15,440 | $41,440 |
| 2021 | $3,755 | $56,880 | $15,440 | $41,440 |
| 2020 | $3,479 | $48,200 | $13,090 | $35,110 |
| 2019 | $3,737 | $137,700 | $37,400 | $100,300 |
| 2018 | $3,385 | $48,200 | $13,090 | $35,110 |
| 2017 | $3,594 | $48,730 | $10,190 | $38,540 |
| 2016 | $3,563 | $48,730 | $10,190 | $38,540 |
| 2015 | $3,436 | $48,730 | $10,190 | $38,540 |
| 2014 | $3,436 | $45,120 | $9,420 | $35,700 |
Source: Public Records
Map
Nearby Homes
- 6535 Ashton Ln
- 6807 Silkwood Ln
- 36145 S Huntington Dr
- 6540 Som Center Rd
- 36145 Bainbridge Rd
- 6531 Arbordale Ave
- 34700 Ada Dr
- 6583 Copley Ave
- 7005 Liberty Rd
- 6676 Solon Blvd
- 6583 Edgemoor Ave
- 36212 Derby Downs Dr
- 6845 Solon Blvd
- 33939 Hanover Woods Trail
- 6662 Edgemoor Ave
- 6607 Forest Glen Ave
- 37755 Flanders Dr
- 6765 Glenallen Ave
- 6414 Glenallen Ave
- 33222 Warwickshire Ln
- 35500 Aurora Rd
- 35540 Aurora Rd
- 35380 Aurora Rd
- 35475 Aurora Rd
- 35425 Aurora Rd
- 35580 Aurora Rd
- 35385 Aurora Rd
- 35505 Aurora Rd
- 35340 Aurora Rd
- 35355 Aurora Rd
- 35600 Aurora Rd
- 35545 Aurora Rd
- 35335 Aurora Rd
- 35599 Aurora Rd
- 35285 Aurora Rd
- 6652 Ayleshire Dr
- 35615 Aurora Rd
- 6658 Ayleshire Dr
- 6670 Ayleshire Dr
- 35245 Aurora Rd