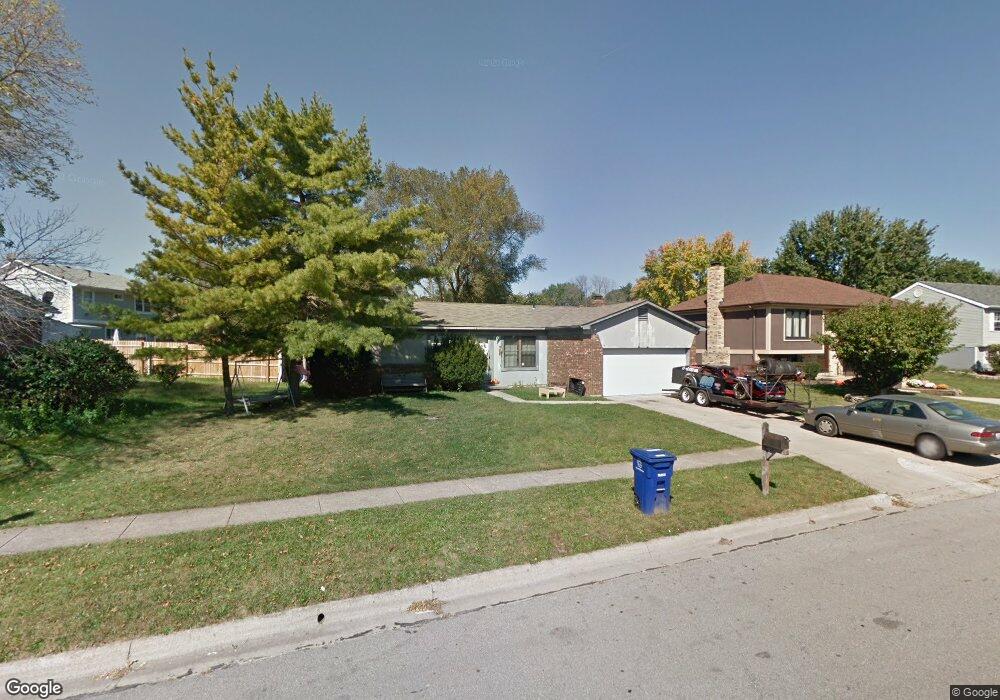
3961 Marsha Dr Columbus, OH 43207
Far South NeighborhoodEstimated Value: $204,000 - $248,000
3
Beds
2
Baths
1,292
Sq Ft
$177/Sq Ft
Est. Value
About This Home
This home is located at 3961 Marsha Dr, Columbus, OH 43207 and is currently estimated at $229,325, approximately $177 per square foot. 3961 Marsha Dr is a home located in Franklin County with nearby schools including Groveport Madison High School, Groveport Community School, and South Columbus Preparatory Academy at Southfield.
Ownership History
Date
Name
Owned For
Owner Type
Purchase Details
Closed on
Aug 22, 2005
Sold by
Wells Fargo Bank Minnesota Na
Bought by
Bush Adam C and Watkins Sara L
Current Estimated Value
Home Financials for this Owner
Home Financials are based on the most recent Mortgage that was taken out on this home.
Original Mortgage
$87,150
Outstanding Balance
$48,156
Interest Rate
5.89%
Mortgage Type
Fannie Mae Freddie Mac
Estimated Equity
$178,848
Purchase Details
Closed on
Aug 23, 2004
Sold by
Clawson Robert J and Case #03Cve09 10084
Bought by
Wells Fargo Bank Minnesota Na and Merrill Lynch Mortgage Investors Inc
Purchase Details
Closed on
Mar 21, 2002
Sold by
Greenfield David H
Bought by
Clawson Robert J
Home Financials for this Owner
Home Financials are based on the most recent Mortgage that was taken out on this home.
Original Mortgage
$76,000
Interest Rate
9.99%
Mortgage Type
Purchase Money Mortgage
Purchase Details
Closed on
Nov 30, 1989
Bought by
Greenfield Susan P Tr
Purchase Details
Closed on
Feb 1, 1986
Purchase Details
Closed on
Oct 1, 1978
Create a Home Valuation Report for This Property
The Home Valuation Report is an in-depth analysis detailing your home's value as well as a comparison with similar homes in the area
Home Values in the Area
Average Home Value in this Area
Purchase History
| Date | Buyer | Sale Price | Title Company |
|---|---|---|---|
| Bush Adam C | $87,200 | Magee Title | |
| Wells Fargo Bank Minnesota Na | $58,000 | -- | |
| Clawson Robert J | $75,900 | -- | |
| Greenfield Susan P Tr | -- | -- | |
| -- | $51,900 | -- | |
| -- | $49,900 | -- |
Source: Public Records
Mortgage History
| Date | Status | Borrower | Loan Amount |
|---|---|---|---|
| Open | Bush Adam C | $87,150 | |
| Previous Owner | Clawson Robert J | $76,000 |
Source: Public Records
Tax History Compared to Growth
Tax History
| Year | Tax Paid | Tax Assessment Tax Assessment Total Assessment is a certain percentage of the fair market value that is determined by local assessors to be the total taxable value of land and additions on the property. | Land | Improvement |
|---|---|---|---|---|
| 2024 | $2,667 | $62,900 | $19,250 | $43,650 |
| 2023 | $2,642 | $62,895 | $19,250 | $43,645 |
| 2022 | $1,557 | $30,840 | $8,050 | $22,790 |
| 2021 | $1,562 | $30,840 | $8,050 | $22,790 |
| 2020 | $1,564 | $30,840 | $8,050 | $22,790 |
| 2019 | $1,556 | $27,440 | $7,000 | $20,440 |
| 2018 | $1,767 | $27,440 | $7,000 | $20,440 |
| 2017 | $1,760 | $27,440 | $7,000 | $20,440 |
| 2016 | $1,948 | $29,620 | $5,780 | $23,840 |
| 2015 | $1,968 | $29,620 | $5,780 | $23,840 |
| 2014 | $1,897 | $29,620 | $5,780 | $23,840 |
| 2013 | $882 | $31,185 | $6,090 | $25,095 |
Source: Public Records
Map
Nearby Homes
- 3232 Williams Rd
- 3246 Williams Rd
- 2587 Weeping Willow Ct
- 2659 Four Seasons Dr Unit 661
- 4037 Millview Ct
- 2651 Winningwillow Dr
- 3062 Nomination Ln Unit 260
- 3702 Petiole Way
- 0 Alum Creek Dr Unit 225007823
- 2836 Palisades Ave
- 2795 Valley Green Dr
- 2295 Maureen Blvd S
- 2229 Maureen Blvd N
- 3887 Highland Bluff Dr
- 2723 Mchenry Dr
- 2715 Mchenry Dr
- 2711 Mchenry Dr
- 4310 Charlotte Rd
- 2377 E Howard Rd
- 4873 Bixby Ridge Dr W
- 3953 Marsha Dr
- 3972 Wintercress Ct
- 3971 Marsha Dr
- 3962 Wintercress Ct
- 3947 Marsha Dr
- 3950 Wintercress Ct
- 3966 Marsha Dr
- 3939 Marsha Dr
- 3974 Marsha Dr
- 3958 Marsha Dr
- 3942 Wintercress Ct
- 3982 Marsha Dr
- 3934 Wintercress Ct
- 3944 Marsha Dr
- 3931 Marsha Dr
- 3985 Wintercress Ct
- 3928 Wintercress Ct
- 3990 Marsha Dr
- 3977 Wintercress Ct
- 2846 Millrace Dr