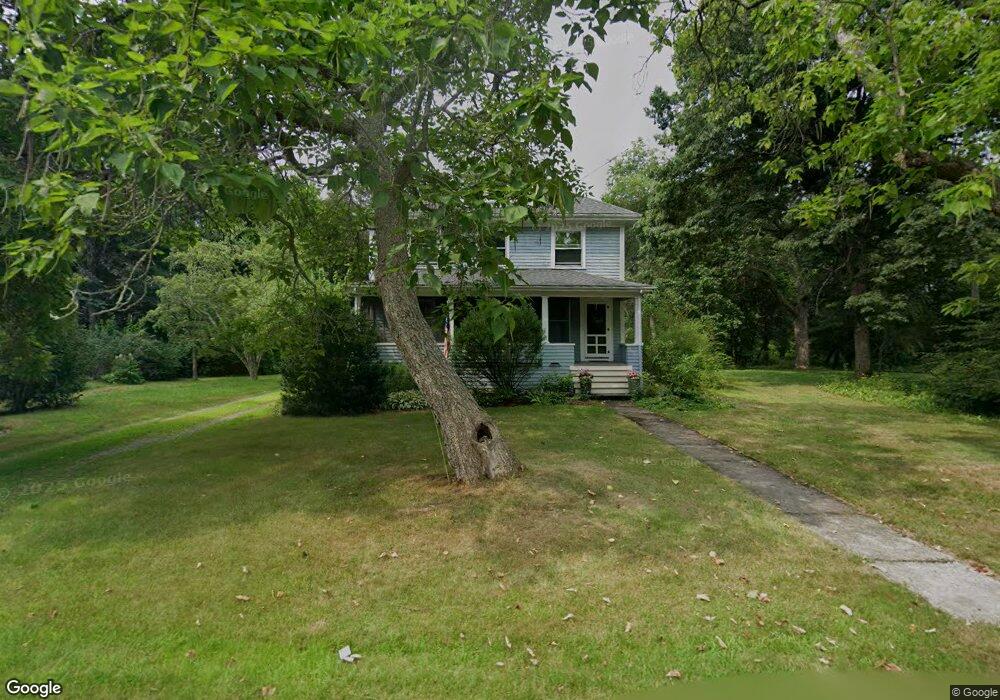
43 Burt St Norton, MA 02766
Estimated Value: $657,667 - $796,000
5
Beds
2
Baths
2,224
Sq Ft
$328/Sq Ft
Est. Value
About This Home
This home is located at 43 Burt St, Norton, MA 02766 and is currently estimated at $729,167, approximately $327 per square foot. 43 Burt St is a home located in Bristol County with nearby schools including L.G. Nourse Elementary School, Henri A. Yelle Elementary School, and Norton Middle School.
Ownership History
Date
Name
Owned For
Owner Type
Purchase Details
Closed on
Oct 18, 2013
Sold by
Esther Holmes Ret and Mereier
Bought by
Taylor Katherine
Current Estimated Value
Home Financials for this Owner
Home Financials are based on the most recent Mortgage that was taken out on this home.
Original Mortgage
$160,000
Outstanding Balance
$118,432
Interest Rate
4.58%
Mortgage Type
New Conventional
Estimated Equity
$610,735
Purchase Details
Closed on
May 15, 1996
Sold by
Shell Oil Co
Bought by
Holmes Esther
Create a Home Valuation Report for This Property
The Home Valuation Report is an in-depth analysis detailing your home's value as well as a comparison with similar homes in the area
Home Values in the Area
Average Home Value in this Area
Purchase History
| Date | Buyer | Sale Price | Title Company |
|---|---|---|---|
| Taylor Katherine | $200,000 | -- | |
| Taylor Katherine | $200,000 | -- | |
| Holmes Esther | $3,755 | -- |
Source: Public Records
Mortgage History
| Date | Status | Borrower | Loan Amount |
|---|---|---|---|
| Open | Taylor Katherine | $160,000 | |
| Closed | Taylor Katherine | $160,000 |
Source: Public Records
Tax History
| Year | Tax Paid | Tax Assessment Tax Assessment Total Assessment is a certain percentage of the fair market value that is determined by local assessors to be the total taxable value of land and additions on the property. | Land | Improvement |
|---|---|---|---|---|
| 2025 | $67 | $514,800 | $200,300 | $314,500 |
| 2024 | $6,353 | $490,600 | $190,700 | $299,900 |
| 2023 | $5,977 | $460,100 | $179,800 | $280,300 |
| 2022 | $5,792 | $406,200 | $163,500 | $242,700 |
| 2021 | $11,498 | $368,400 | $155,700 | $212,700 |
| 2020 | $2,861 | $357,900 | $151,100 | $206,800 |
| 2019 | $4,743 | $345,300 | $145,400 | $199,900 |
| 2018 | $4,998 | $329,700 | $145,400 | $184,300 |
| 2017 | $4,688 | $316,600 | $145,400 | $171,200 |
| 2016 | $4,713 | $301,900 | $145,400 | $156,500 |
| 2015 | $4,477 | $290,900 | $142,600 | $148,300 |
| 2014 | $4,268 | $277,700 | $135,800 | $141,900 |
Source: Public Records
Map
Nearby Homes
- 35 Owen Rd
- O Leonard St
- 210 Bay Rd
- 46 Newland St
- 9 Winnecunnet Dr Unit 9
- 1 Wilbur Terrace Unit 6
- 1 Wilbur Terrace Unit 2
- 39 Cranberry Ln
- 195 E Main St
- 0 Knollwood & 0 Rear Kensington
- 108 Norton Ave Unit 14
- 0 S Washington St Unit 73437419
- 0 Kensington Rd
- 17 Pinebrook Ln Unit 3
- 3 Patlena Dr
- 17 Lloyd Cir Unit 36
- 24 Lloyd Cir Unit 34
- 16 Lloyd Cir Unit 30
- 4 Stanley Rd
- 157 Highland St
Your Personal Tour Guide
Ask me questions while you tour the home.