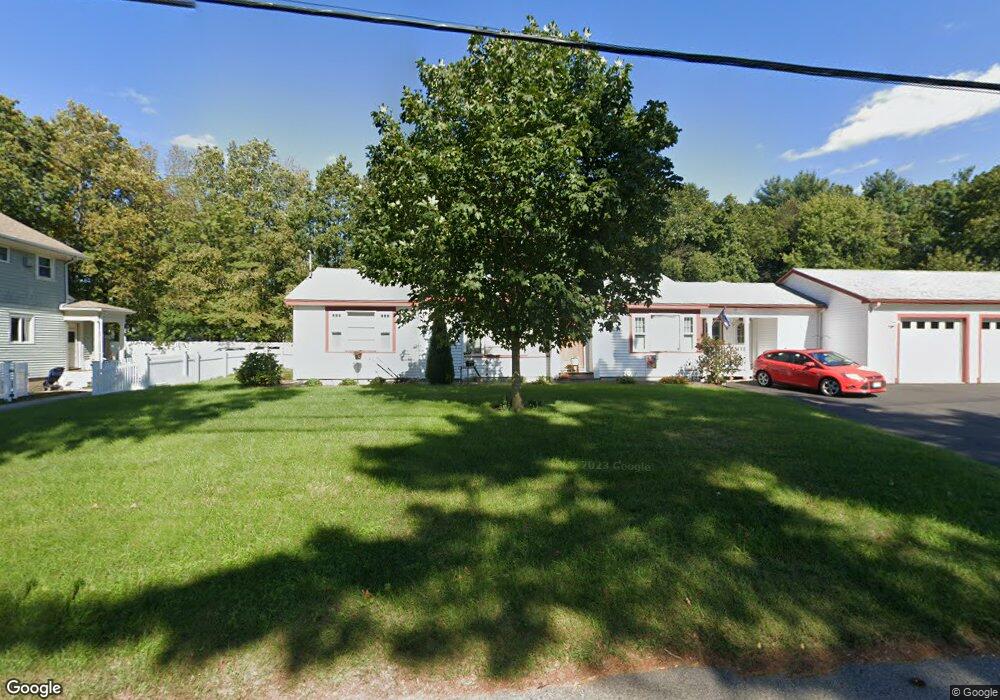
44 Spring St Medfield, MA 02052
Estimated Value: $840,941 - $932,000
3
Beds
2
Baths
2,056
Sq Ft
$429/Sq Ft
Est. Value
About This Home
This home is located at 44 Spring St, Medfield, MA 02052 and is currently estimated at $881,735, approximately $428 per square foot. 44 Spring St is a home located in Norfolk County with nearby schools including Memorial School, Dale Street School, and Ralph Wheelock School.
Ownership History
Date
Name
Owned For
Owner Type
Purchase Details
Closed on
Sep 5, 2018
Sold by
Dornig Edward J and Dornig Laurie N
Bought by
Dornig Edward J and Dornig Laurie N
Current Estimated Value
Purchase Details
Closed on
Jul 12, 2011
Sold by
Doring Laurie N
Bought by
Doring Edward J
Create a Home Valuation Report for This Property
The Home Valuation Report is an in-depth analysis detailing your home's value as well as a comparison with similar homes in the area
Home Values in the Area
Average Home Value in this Area
Purchase History
| Date | Buyer | Sale Price | Title Company |
|---|---|---|---|
| Dornig Edward J | -- | -- | |
| Dornig Edward J | -- | -- | |
| Doring Edward J | -- | -- | |
| Doring Edward J | -- | -- | |
| Doring Laurie N | -- | -- |
Source: Public Records
Mortgage History
| Date | Status | Borrower | Loan Amount |
|---|---|---|---|
| Open | Dornig Edward J | $380,000 | |
| Previous Owner | Dornig Edward J | $200,000 | |
| Previous Owner | Dornig Edward J | $224,000 | |
| Previous Owner | Dornig Edward J | $200,000 |
Source: Public Records
Tax History Compared to Growth
Tax History
| Year | Tax Paid | Tax Assessment Tax Assessment Total Assessment is a certain percentage of the fair market value that is determined by local assessors to be the total taxable value of land and additions on the property. | Land | Improvement |
|---|---|---|---|---|
| 2025 | $9,550 | $692,000 | $370,300 | $321,700 |
| 2024 | $9,463 | $646,400 | $343,200 | $303,200 |
| 2023 | $9,361 | $606,700 | $325,200 | $281,500 |
| 2022 | $8,992 | $516,200 | $307,100 | $209,100 |
| 2021 | $8,695 | $489,600 | $298,100 | $191,500 |
| 2020 | $8,480 | $475,600 | $290,800 | $184,800 |
| 2019 | $8,143 | $455,700 | $280,000 | $175,700 |
| 2018 | $7,357 | $432,000 | $261,900 | $170,100 |
| 2017 | $7,144 | $423,000 | $252,900 | $170,100 |
| 2016 | $7,055 | $421,200 | $251,100 | $170,100 |
| 2015 | $6,397 | $398,800 | $242,500 | $156,300 |
| 2014 | $6,010 | $372,800 | $221,100 | $151,700 |
Source: Public Records
Map
Nearby Homes
- 42 Spring St
- 45 Spring St
- 36 Spring St
- 48 Spring St
- 43 Spring St
- 2 Kingsbury Dr Unit 2A
- 2 Kingsbury Dr
- 2 Kingsbury Dr Unit 2
- 2 A Kingsbury Dr Unit 2A
- 2 A Kingsbury Dr
- 2 A Kingsbury Dr Unit 2/2
- 50 Spring St
- 32 Spring St
- 32r Spring St Unit B
- 32r Spring St Unit 8
- 32r Spring St Unit 7
- 32r Spring St Unit 207
- 32r Spring St Unit 206
- 32r Spring St Unit 6
- 32r Spring St Unit 3