459 W Main St Norwich, CT 06360
Central Norwich NeighborhoodEstimated payment $567/month
Highlights
- Property is near public transit
- Public Transportation
- Level Lot
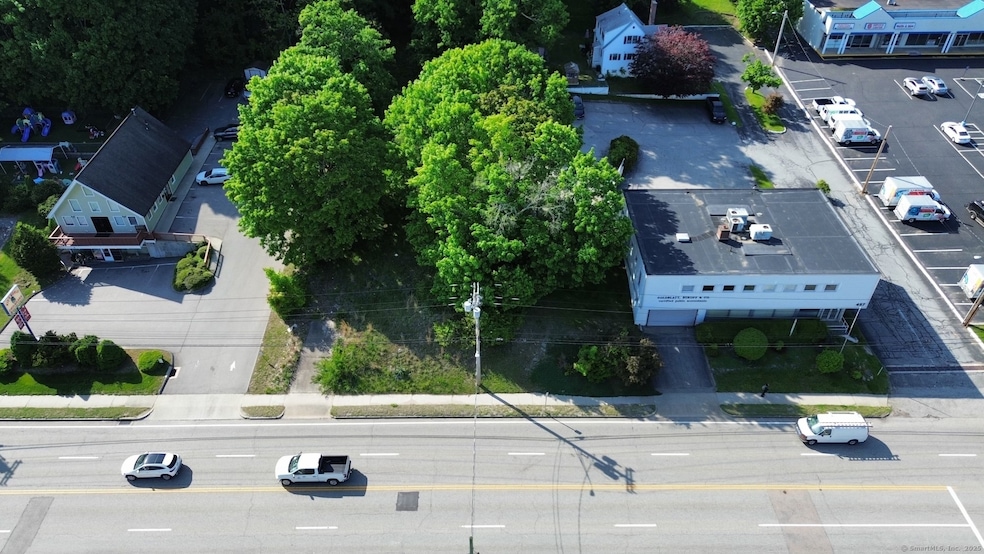
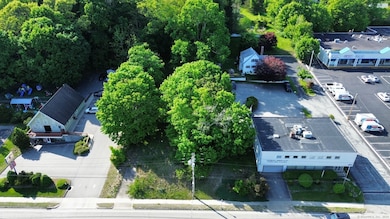
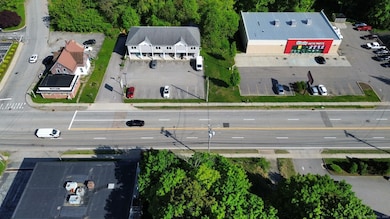
About This Lot
Commercial land with frontage along busiest streets in Norwich, CT. Perfect land for commercial needs. Reach out about this property today
Listing Agent
Drawbridge Realty Brokerage Phone: (401) 265-8359 License #RES.0825529 Listed on: 01/02/2025
Property Details
Property Type
- Land
Est. Annual Taxes
- $514
Lot Details
- 0.33 Acre Lot
- Level Lot
- Property is zoned GC
Location
- Property is near public transit
- Property is near shops
- Property is near a golf course
Utilities
- Gas Available
- Phone Available
- Cable TV Available
Community Details
- Public Transportation
Listing and Financial Details
- Assessor Parcel Number 2020650
Map
Home Values in the Area
Average Home Value in this Area
Tax History
| Year | Tax Paid | Tax Assessment Tax Assessment Total Assessment is a certain percentage of the fair market value that is determined by local assessors to be the total taxable value of land and additions on the property. | Land | Improvement |
|---|---|---|---|---|
| 2025 | $510 | $12,600 | $10,900 | $1,700 |
| 2024 | $481 | $12,600 | $10,900 | $1,700 |
| 2023 | $399 | $8,200 | $6,900 | $1,300 |
| 2022 | $398 | $8,200 | $6,900 | $1,300 |
| 2021 | $399 | $8,200 | $6,900 | $1,300 |
| 2020 | $397 | $8,200 | $6,900 | $1,300 |
| 2019 | $394 | $8,200 | $6,900 | $1,300 |
| 2018 | $353 | $7,300 | $6,600 | $700 |
| 2017 | $356 | $7,300 | $6,600 | $700 |
| 2016 | $358 | $7,300 | $6,600 | $700 |
| 2015 | $351 | $7,300 | $6,600 | $700 |
| 2014 | $335 | $7,300 | $6,600 | $700 |
Property History
| Date | Event | Price | List to Sale | Price per Sq Ft | Prior Sale |
|---|---|---|---|---|---|
| 01/02/2025 01/02/25 | For Sale | $100,000 | +233.3% | -- | |
| 06/07/2022 06/07/22 | Sold | $30,000 | -49.2% | -- | View Prior Sale |
| 06/03/2022 06/03/22 | Pending | -- | -- | -- | |
| 11/22/2021 11/22/21 | For Sale | $59,000 | -- | -- |
Purchase History
| Date | Type | Sale Price | Title Company |
|---|---|---|---|
| Warranty Deed | -- | None Available | |
| Warranty Deed | -- | None Available | |
| Warranty Deed | $80,000 | -- | |
| Warranty Deed | $80,000 | -- | |
| Deed | $32,000 | -- |
Mortgage History
| Date | Status | Loan Amount | Loan Type |
|---|---|---|---|
| Previous Owner | $80,000 | Purchase Money Mortgage | |
| Previous Owner | $29,000 | Purchase Money Mortgage |
Source: SmartMLS
MLS Number: 24066238
APN: NORW-000108-000003-000026
Disclaimer: Certain information contained herein is derived from information provided by parties other than Homes.com. All information provided is deemed reliable, but is not guaranteed to be accurate and should be independently verified.
![]() IDX information is provided exclusively for personal, non-commercial use, and may not be used for any purpose other than to identify prospective properties consumers may be interested in purchasing. Information is deemed reliable but not guaranteed.
IDX information is provided exclusively for personal, non-commercial use, and may not be used for any purpose other than to identify prospective properties consumers may be interested in purchasing. Information is deemed reliable but not guaranteed.
- 189 Maple St
- 510 W Main St
- 18 Pine St
- 41 Peck St
- 57 Maple St
- 35 Elizabeth St
- 3 Willey Place
- 46 Pearl St
- 33 Newton St
- 14 Pearl St
- 9 Deerbrook Rd
- 138 Newton St
- 520 New London Turnpike
- 40 Spring Garden Ave Unit 42
- 1 George St
- 27 Sycamore Rd
- 40 Maple Grove Ave
- 61 School St
- 9 Starrwood Dr Unit 9
- 10 Mitchell Ct
- 70 Mechanic St
- 3 Summitwoods Dr
- 10 Gregory Rd
- 13 Ward St
- 69 Summit St
- 10 Brown St Unit 10 Brown St
- 1 Stetson St
- 85 W Thames St
- 73 W Thames St Unit 73B
- 2-78 Church St
- 118 Water St
- 201 Main St
- 15 Broad St
- 102 Salem Turnpike
- 11 Bath St
- 99 Cedar St
- 253 Yantic St
- 8 Dogwood Ln
- 120 Broadway Unit 3
- 2124 Old Pond Ln Unit 2124 Old Pond Ln
