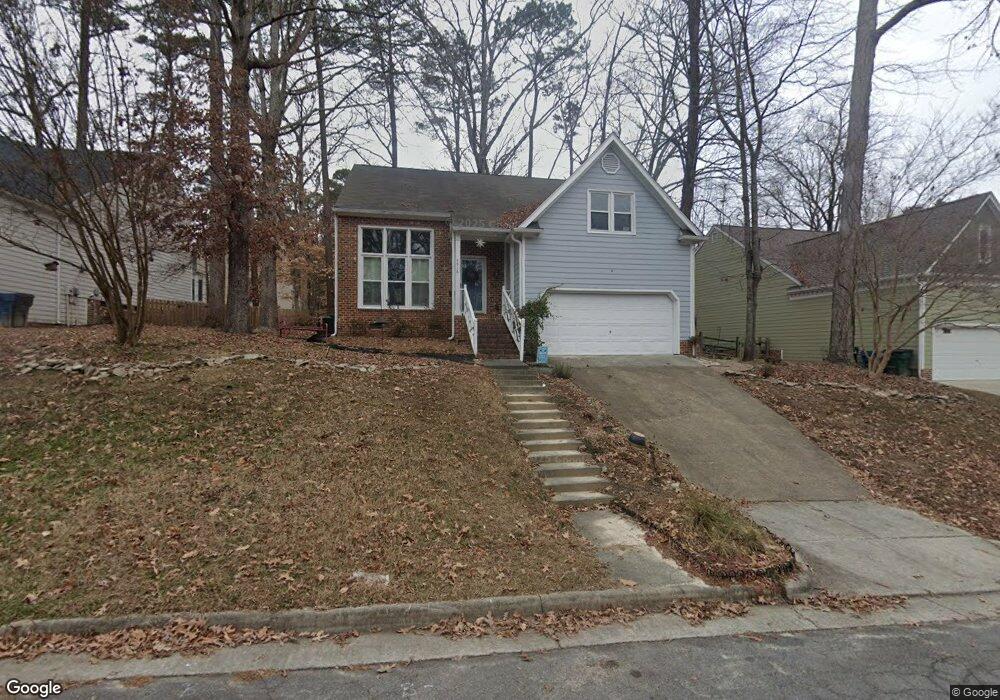
4916 Glendarion Dr Durham, NC 27713
Woodcroft NeighborhoodEstimated Value: $475,000 - $509,000
3
Beds
3
Baths
2,131
Sq Ft
$231/Sq Ft
Est. Value
About This Home
This home is located at 4916 Glendarion Dr, Durham, NC 27713 and is currently estimated at $492,216, approximately $230 per square foot. 4916 Glendarion Dr is a home located in Durham County with nearby schools including Southwest Elementary School, Morehead Montessori, and Sherwood Githens Middle.
Ownership History
Date
Name
Owned For
Owner Type
Purchase Details
Closed on
Sep 27, 2019
Sold by
Tuck Dustin Nathaniel and Tuck Ellen Barbee
Bought by
Dickerson Karyn C and Dickerson Jade K
Current Estimated Value
Home Financials for this Owner
Home Financials are based on the most recent Mortgage that was taken out on this home.
Original Mortgage
$228,000
Outstanding Balance
$202,308
Interest Rate
3.6%
Mortgage Type
New Conventional
Estimated Equity
$281,248
Purchase Details
Closed on
Dec 15, 2016
Sold by
Hirsch Stephen E
Bought by
Tuck Dustin Nathaniel and Tuck Ellen Barbee
Home Financials for this Owner
Home Financials are based on the most recent Mortgage that was taken out on this home.
Original Mortgage
$220,825
Interest Rate
3.75%
Mortgage Type
FHA
Create a Home Valuation Report for This Property
The Home Valuation Report is an in-depth analysis detailing your home's value as well as a comparison with similar homes in the area
Home Values in the Area
Average Home Value in this Area
Purchase History
| Date | Buyer | Sale Price | Title Company |
|---|---|---|---|
| Dickerson Karyn C | $285,000 | None Available | |
| Tuck Dustin Nathaniel | $225,000 | -- |
Source: Public Records
Mortgage History
| Date | Status | Borrower | Loan Amount |
|---|---|---|---|
| Open | Dickerson Karyn C | $228,000 | |
| Previous Owner | Tuck Dustin Nathaniel | $220,825 | |
| Previous Owner | Hirsch Stephen E | $75,000 | |
| Previous Owner | Hirsch Stephen E | $120,000 | |
| Previous Owner | Hirsch Stephen E | $125,000 | |
| Previous Owner | Hirsch Stephen E | $134,000 |
Source: Public Records
Tax History Compared to Growth
Tax History
| Year | Tax Paid | Tax Assessment Tax Assessment Total Assessment is a certain percentage of the fair market value that is determined by local assessors to be the total taxable value of land and additions on the property. | Land | Improvement |
|---|---|---|---|---|
| 2024 | $3,762 | $269,671 | $52,650 | $217,021 |
| 2023 | $3,532 | $269,716 | $52,695 | $217,021 |
| 2022 | $3,421 | $267,308 | $52,695 | $214,613 |
| 2021 | $3,405 | $267,308 | $52,695 | $214,613 |
| 2020 | $3,325 | $267,308 | $52,695 | $214,613 |
| 2019 | $3,325 | $267,308 | $52,695 | $214,613 |
| 2018 | $3,235 | $238,462 | $40,985 | $197,477 |
| 2017 | $3,211 | $238,462 | $40,985 | $197,477 |
| 2016 | $3,103 | $238,462 | $40,985 | $197,477 |
| 2015 | $2,898 | $209,344 | $36,270 | $173,074 |
| 2014 | -- | $209,344 | $36,270 | $173,074 |
Source: Public Records
Map
Nearby Homes
- 3908 Sturbridge Dr
- 4903 Bridgewood Dr
- 4 Birkdale Ct
- 5219 Oakbrook Dr
- 29 Citation Dr
- 135 Shadow Hawk Dr
- 3706 Chimney Ridge Place Unit 8
- 4 Applewood Square
- 135 Long Shadow Place
- 4117 Settlement Dr
- 127 Long Shadow Place
- 121 Long Shadow Place
- 5500 Fortunes Ridge Dr Unit 94C
- 5500 Fortunes Ridge Dr Unit 82B
- 53 Willow Bridge Dr
- 517 Woodwinds Dr
- 4712 Alderbrook Ln
- 15 Willow Bridge Dr
- 18 Willow Bridge Dr
- 616 Cross Timbers Dr
- 3911 Blakeford Dr
- 4911 Victoria Dr
- 4913 Victoria Dr
- 4909 Victoria Dr
- 4910 Glendarion Dr
- 4915 Glendarion Dr
- 4917 Glendarion Dr
- 4921 Glendarion Dr
- 4907 Victoria Dr
- 4906 Glendarion Dr
- 4909 Glendarion Dr
- 3912 Blakeford Dr
- 3910 Blakeford Dr
- 4903 Victoria Dr
- 4 Wexford Dr
- 4007 Blakeford Dr
- 4912 Victoria Dr
- 4002 Blakeford Dr
- 3908 Blakeford Dr
- 4910 Victoria Dr