Estimated Value: $127,000 - $185,000
--
Bed
--
Bath
1,900
Sq Ft
$82/Sq Ft
Est. Value
About This Home
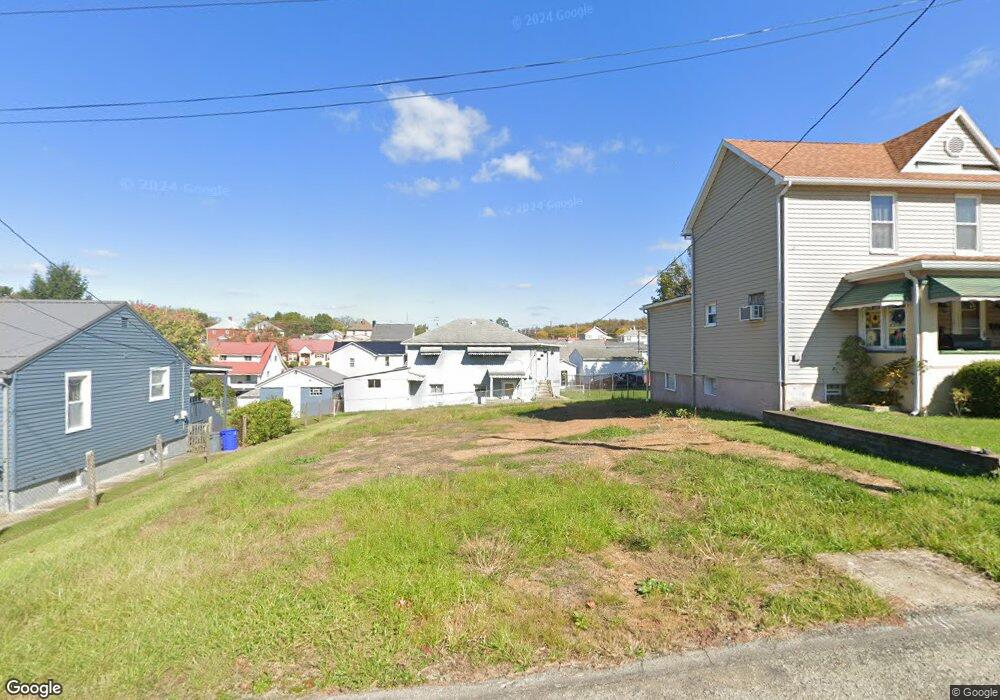
This home is located at 5 Penn St, Mount Pleasant, PA 15666 and is currently estimated at $156,033, approximately $82 per square foot. 5 Penn St is a home located in Westmoreland County with nearby schools including Mount Pleasant Area High School.
Ownership History
Date
Name
Owned For
Owner Type
Purchase Details
Closed on
Aug 8, 2023
Sold by
Westmoreland County Tax Claim Bureau
Bought by
Westmoreland County Land Bank
Current Estimated Value
Purchase Details
Closed on
Feb 18, 2005
Sold by
Guzik Mark N
Bought by
Kerrigan Sean
Home Financials for this Owner
Home Financials are based on the most recent Mortgage that was taken out on this home.
Original Mortgage
$63,750
Interest Rate
8.62%
Mortgage Type
Purchase Money Mortgage
Create a Home Valuation Report for This Property
The Home Valuation Report is an in-depth analysis detailing your home's value as well as a comparison with similar homes in the area
Home Values in the Area
Average Home Value in this Area
Purchase History
| Date | Buyer | Sale Price | Title Company |
|---|---|---|---|
| Westmoreland County Land Bank | $1,898 | None Listed On Document | |
| Kerrigan Sean | $75,000 | -- |
Source: Public Records
Mortgage History
| Date | Status | Borrower | Loan Amount |
|---|---|---|---|
| Previous Owner | Kerrigan Sean | $63,750 |
Source: Public Records
Tax History Compared to Growth
Tax History
| Year | Tax Paid | Tax Assessment Tax Assessment Total Assessment is a certain percentage of the fair market value that is determined by local assessors to be the total taxable value of land and additions on the property. | Land | Improvement |
|---|---|---|---|---|
| 2025 | -- | $820 | $820 | $0 |
| 2024 | $905 | $9,750 | $820 | $8,930 |
| 2023 | $1,138 | $9,750 | $820 | $8,930 |
| 2022 | $1,138 | $9,750 | $820 | $8,930 |
| 2021 | $1,119 | $9,750 | $820 | $8,930 |
| 2020 | $1,119 | $9,750 | $820 | $8,930 |
| 2019 | $1,114 | $9,750 | $820 | $8,930 |
| 2018 | $1,114 | $9,750 | $820 | $8,930 |
| 2017 | $1,092 | $9,750 | $820 | $8,930 |
| 2016 | $1,044 | $9,750 | $820 | $8,930 |
| 2015 | $1,044 | $9,750 | $820 | $8,930 |
| 2014 | $1,006 | $9,750 | $820 | $8,930 |
Source: Public Records
Map
Nearby Homes
- 112 Yoder Ave
- 132 Liberty St
- 0 Smithfield Hitchman
- 225 S Shupe St
- 101 N Mulberry Dr
- 320 W Main St
- 126 N Hitchman St
- 243 S Sycamore St
- 35 N Hitchman St
- 6775 Low St
- 5118 Holly Rd
- 6799 Low St
- 6808 Low St
- 137 Mellingertown Rd
- 5 Trice Dr
- 112 N Hazelnut Dr
- 539 Pine St
- 690 Orchard Ave
- 508 Hemlock St
- 801 Wimbledon Dr