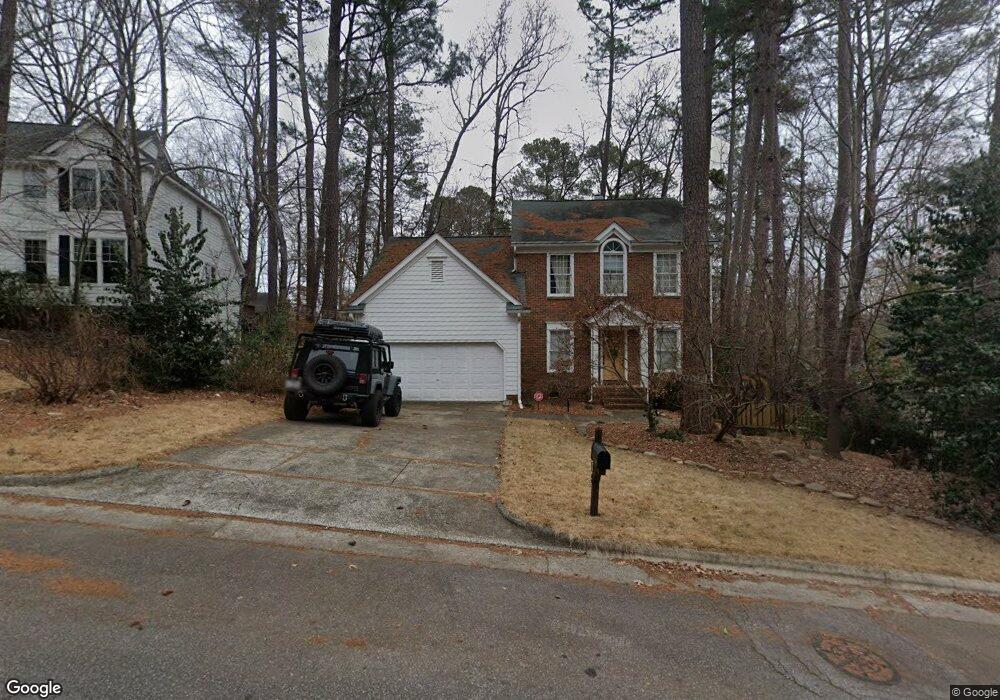
5113 Oakbrook Dr Durham, NC 27713
Woodcroft NeighborhoodEstimated Value: $447,000 - $552,000
4
Beds
3
Baths
1,984
Sq Ft
$257/Sq Ft
Est. Value
About This Home
This home is located at 5113 Oakbrook Dr, Durham, NC 27713 and is currently estimated at $510,498, approximately $257 per square foot. 5113 Oakbrook Dr is a home located in Durham County with nearby schools including Southwest Elementary School, Morehead Montessori, and Sherwood Githens Middle.
Ownership History
Date
Name
Owned For
Owner Type
Purchase Details
Closed on
Apr 14, 2025
Sold by
Cohen Paula and Beaty Paula Leigh
Bought by
Beaty Paula Leigh
Current Estimated Value
Purchase Details
Closed on
Jul 16, 2010
Sold by
Cohen Robert and Cohen Paula
Bought by
Cohen Paula
Home Financials for this Owner
Home Financials are based on the most recent Mortgage that was taken out on this home.
Original Mortgage
$189,750
Interest Rate
4.61%
Mortgage Type
New Conventional
Purchase Details
Closed on
Apr 28, 1999
Sold by
Friedly Gary P and Wife Doris G
Bought by
Cohen Robert P and Cohen Paula L
Home Financials for this Owner
Home Financials are based on the most recent Mortgage that was taken out on this home.
Original Mortgage
$175,750
Interest Rate
7.06%
Create a Home Valuation Report for This Property
The Home Valuation Report is an in-depth analysis detailing your home's value as well as a comparison with similar homes in the area
Home Values in the Area
Average Home Value in this Area
Purchase History
| Date | Buyer | Sale Price | Title Company |
|---|---|---|---|
| Beaty Paula Leigh | -- | None Listed On Document | |
| Beaty Paula Leigh | -- | None Listed On Document | |
| Cohen Paula | -- | None Available | |
| Cohen Robert P | $185,000 | -- |
Source: Public Records
Mortgage History
| Date | Status | Borrower | Loan Amount |
|---|---|---|---|
| Previous Owner | Beaty Paula | $250,000 | |
| Previous Owner | Beaty Paula | $50,000 | |
| Previous Owner | Beaty Paula Leigh | $171,000 | |
| Previous Owner | Cohen Paula Leigh | $189,750 | |
| Previous Owner | Cohen Robert P | $170,000 | |
| Previous Owner | Cohen Robert P | $175,750 |
Source: Public Records
Tax History Compared to Growth
Tax History
| Year | Tax Paid | Tax Assessment Tax Assessment Total Assessment is a certain percentage of the fair market value that is determined by local assessors to be the total taxable value of land and additions on the property. | Land | Improvement |
|---|---|---|---|---|
| 2024 | $3,947 | $282,971 | $55,215 | $227,756 |
| 2023 | $3,707 | $282,971 | $55,215 | $227,756 |
| 2022 | $3,622 | $282,971 | $55,215 | $227,756 |
| 2021 | $3,605 | $282,971 | $55,215 | $227,756 |
| 2020 | $3,520 | $282,971 | $55,215 | $227,756 |
| 2019 | $3,520 | $282,971 | $55,215 | $227,756 |
| 2018 | $3,329 | $245,424 | $42,945 | $202,479 |
| 2017 | $3,305 | $245,424 | $42,945 | $202,479 |
| 2016 | $3,193 | $245,424 | $42,945 | $202,479 |
| 2015 | $3,287 | $237,430 | $43,851 | $193,579 |
| 2014 | $3,287 | $237,430 | $43,851 | $193,579 |
Source: Public Records
Map
Nearby Homes
- 3908 Sturbridge Dr
- 5219 Oakbrook Dr
- 4903 Bridgewood Dr
- 4 Birkdale Ct
- 29 Citation Dr
- 3706 Chimney Ridge Place Unit 8
- 135 Long Shadow Place
- 4 Applewood Square
- 127 Long Shadow Place
- 121 Long Shadow Place
- 135 Shadow Hawk Dr
- 4117 Settlement Dr
- 53 Willow Bridge Dr
- 517 Woodwinds Dr
- 18 Willow Bridge Dr
- 15 Willow Bridge Dr
- 5500 Fortunes Ridge Dr Unit 94C
- 5500 Fortunes Ridge Dr Unit 82B
- 616 Cross Timbers Dr
- 7 Old Towne Place
- 5111 Oakbrook Dr
- 5115 Oakbrook Dr
- 3912 Blakeford Dr
- 4002 Blakeford Dr
- 3910 Blakeford Dr
- 5107 Oakbrook Dr
- 5117 Oakbrook Dr
- 5103 Longwood Dr
- 3908 Blakeford Dr
- 4006 Blakeford Dr
- 5116 Oakbrook Dr
- 4008 Blakeford Dr
- 3906 Blakeford Dr
- 5103 Oakbrook Dr
- 5119 Oakbrook Dr
- 5105 Longwood Dr
- 5102 Longwood Dr
- 5118 Oakbrook Dr
- 4010 Blakeford Dr
- 3904 Blakeford Dr