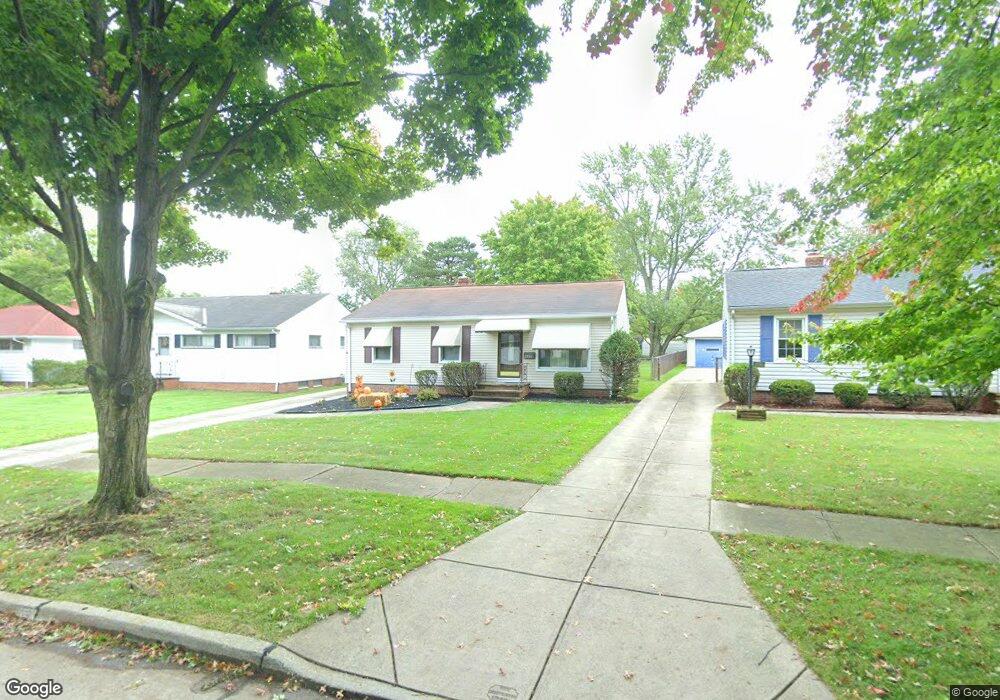
6399 Stratford Dr Parma Heights, OH 44130
Estimated Value: $179,000 - $196,000
3
Beds
1
Bath
1,094
Sq Ft
$173/Sq Ft
Est. Value
About This Home
This home is located at 6399 Stratford Dr, Parma Heights, OH 44130 and is currently estimated at $189,791, approximately $173 per square foot. 6399 Stratford Dr is a home located in Cuyahoga County with nearby schools including Greenbriar Middle School, Pleasant Valley Elementary School, and Valley Forge High School.
Ownership History
Date
Name
Owned For
Owner Type
Purchase Details
Closed on
Aug 21, 2020
Sold by
Spisak Stephen M and Spisak Eleanore J
Bought by
Spisak Stephen M
Current Estimated Value
Home Financials for this Owner
Home Financials are based on the most recent Mortgage that was taken out on this home.
Original Mortgage
$76,000
Outstanding Balance
$44,506
Interest Rate
2.9%
Mortgage Type
New Conventional
Estimated Equity
$114,376
Purchase Details
Closed on
Mar 20, 2020
Sold by
Spisak Steve F and Spisak Eleanore J
Bought by
Spisak Eleanore J
Purchase Details
Closed on
Nov 11, 1999
Sold by
Spisak Steve F and Spisak Eleanore
Bought by
Spisak Steve Francis and Spisak Eleanore Justine
Purchase Details
Closed on
Aug 10, 1987
Sold by
Palmer Joseph J
Bought by
Spisak Steve F and Spisak Eleanore
Purchase Details
Closed on
Feb 15, 1977
Sold by
Lahiff Beryl A and Lahiff Wm P
Bought by
Palmer Joseph J
Purchase Details
Closed on
Jan 1, 1975
Bought by
Lahiff Beryl A and Lahiff Wm P
Create a Home Valuation Report for This Property
The Home Valuation Report is an in-depth analysis detailing your home's value as well as a comparison with similar homes in the area
Home Values in the Area
Average Home Value in this Area
Purchase History
| Date | Buyer | Sale Price | Title Company |
|---|---|---|---|
| Spisak Stephen M | $95,100 | Signature Title | |
| Spisak Eleanore J | -- | None Available | |
| Spisak Steve F | -- | None Available | |
| Spisak Steve Francis | -- | -- | |
| Spisak Steve F | $71,500 | -- | |
| Palmer Joseph J | $46,000 | -- | |
| Lahiff Beryl A | -- | -- |
Source: Public Records
Mortgage History
| Date | Status | Borrower | Loan Amount |
|---|---|---|---|
| Open | Spisak Stephen M | $76,000 |
Source: Public Records
Tax History Compared to Growth
Tax History
| Year | Tax Paid | Tax Assessment Tax Assessment Total Assessment is a certain percentage of the fair market value that is determined by local assessors to be the total taxable value of land and additions on the property. | Land | Improvement |
|---|---|---|---|---|
| 2024 | $3,610 | $56,105 | $11,725 | $44,380 |
| 2023 | $2,557 | $33,290 | $9,280 | $24,010 |
| 2022 | $2,544 | $33,290 | $9,280 | $24,010 |
| 2021 | $2,523 | $33,290 | $9,280 | $24,010 |
| 2020 | $2,104 | $33,290 | $7,490 | $25,800 |
| 2019 | $2,049 | $95,100 | $21,400 | $73,700 |
| 2018 | $1,960 | $33,290 | $7,490 | $25,800 |
| 2017 | $1,876 | $29,580 | $5,810 | $23,770 |
| 2016 | $1,864 | $29,580 | $5,810 | $23,770 |
| 2015 | $1,951 | $29,580 | $5,810 | $23,770 |
| 2014 | $1,951 | $30,810 | $6,060 | $24,750 |
Source: Public Records
Map
Nearby Homes
- 6400 Stratford Dr
- 9736 Manorford Dr
- 6418 Newland Rd
- 9313 Crestwood Dr
- 6525 Aylesworth Dr
- 6395 Princeton Ct Unit 203H
- 9355 Newkirk Dr
- 6475 Princeton Ct Unit D201
- 6440 Springwood Rd
- 6359 Olde York Rd Unit 6359
- 6191 Stratford Dr
- 8963 Lynnhaven Rd
- 8408 Whitehaven Dr
- 6111 Denison Blvd
- 8314 Oxford Dr
- 8324 Ackley Rd
- 8321 Wainstead Dr
- 10427 N Church Dr Unit 123
- 8219 Wainstead Dr
- 8021 Whitehaven Dr
- 6395 Stratford Dr
- 6403 Stratford Dr
- 6389 Stratford Dr
- 6407 Stratford Dr
- 6383 Stratford Dr
- 6406 Denison Blvd
- 6412 Denison Blvd
- 6392 Denison Blvd
- 6420 Denison Blvd
- 9800 Manorford Dr
- 6386 Denison Blvd
- 6428 Denison Blvd
- 9768 Manorford Dr
- 6380 Denison Blvd
- 9876 Manorford Dr
- 6436 Denison Blvd
- 6375 Stratford Dr
- 6392 Stratford Dr
- 6386 Stratford Dr
- 9900 Manorford Dr