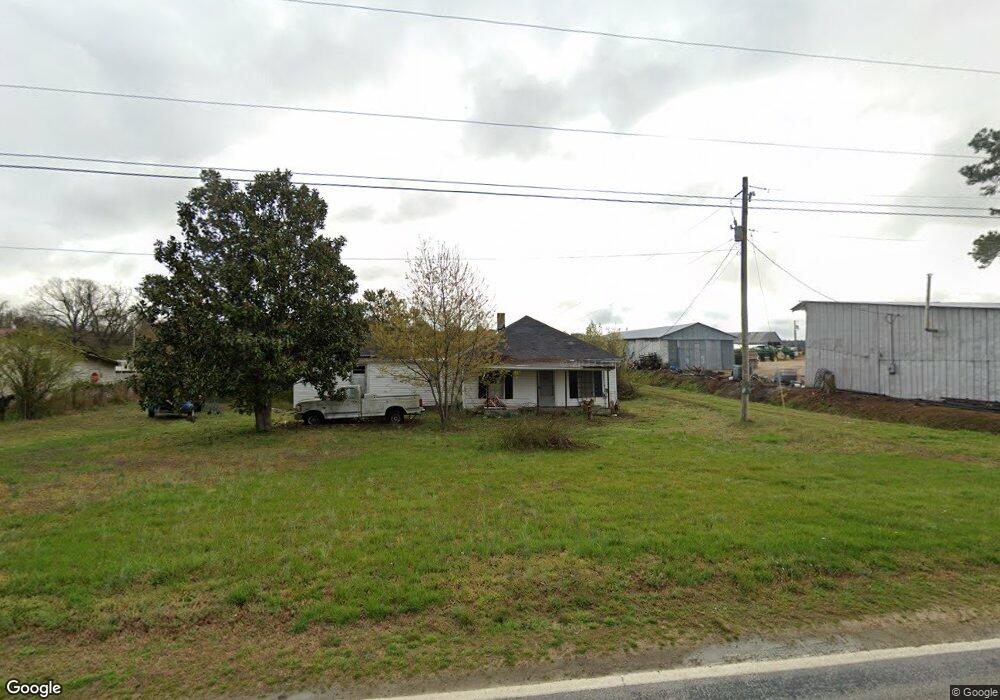
7015 Wheat Swamp Rd Lucama, NC 27851
Estimated Value: $105,362 - $206,000
3
Beds
1
Bath
1,096
Sq Ft
$139/Sq Ft
Est. Value
About This Home
This home is located at 7015 Wheat Swamp Rd, Lucama, NC 27851 and is currently estimated at $152,341, approximately $138 per square foot. 7015 Wheat Swamp Rd is a home located in Wilson County with nearby schools including Lucama Elementary School, Springfield Middle School, and James Hunt High School.
Create a Home Valuation Report for This Property
The Home Valuation Report is an in-depth analysis detailing your home's value as well as a comparison with similar homes in the area
Home Values in the Area
Average Home Value in this Area
Tax History Compared to Growth
Tax History
| Year | Tax Paid | Tax Assessment Tax Assessment Total Assessment is a certain percentage of the fair market value that is determined by local assessors to be the total taxable value of land and additions on the property. | Land | Improvement |
|---|---|---|---|---|
| 2025 | $360 | $43,516 | $11,400 | $32,116 |
| 2024 | $360 | $43,516 | $11,400 | $32,116 |
| 2023 | $290 | $28,329 | $8,550 | $19,779 |
| 2022 | $290 | $28,329 | $8,550 | $19,779 |
| 2021 | $280 | $28,329 | $8,550 | $19,779 |
| 2020 | $280 | $28,329 | $8,550 | $19,779 |
| 2019 | $280 | $28,329 | $8,550 | $19,779 |
| 2018 | $270 | $28,329 | $8,550 | $19,779 |
| 2017 | $270 | $28,329 | $8,550 | $19,779 |
| 2016 | $277 | $28,329 | $8,550 | $19,779 |
| 2014 | $269 | $28,279 | $9,000 | $19,279 |
Source: Public Records
Map
Nearby Homes
- 7309 Powell Hooks Rd
- 7323 Powell Hooks Rd
- 0 Gourd Branch Rd
- 0 Great Swamp Loop
- 110 E Blalock Rd
- 401 Goldsboro St
- 5930 A Glory Rd
- 000 Tbd Rd
- 206 Granite Dr
- 303 E Oak St
- 8126 Tedder Rd
- 6619 Gabriels Way
- 407 Pineview St
- 0 Unit WP001
- 6369 Morningside Rd
- 5645 Muscadine Rd
- 5665 Muscadine Rd
- 5661 Muscadine Rd
- 5367 E Blalock Rd
- 5548 Wellons Ct
- 7013 Wheat Swamp Rd
- 7035 Wheat Swamp Rd
- 7012 Wheat Swamp Rd
- 7025 Wheat Swamp Rd
- 7003 Wheat Swamp Rd
- 6841 Wheat Swamp Rd
- 7009 Wheat Swamp Rd Unit G
- 7009 Wheat Swamp Rd
- 6832 Wheat Swamp Rd
- 6814 Wheat Swamp Rd
- 7102 Wheat Swamp Rd
- 7112 Wheat Swamp Rd
- 6625 Little Rock Church Rd
- 7116 Wheat Swamp Rd
- 6735 Wheat Swamp Rd
- 7140 Wheat Swamp Rd
- 7378 Gourd Branch Rd
- 6654 Little Rock Church Rd
- 6642 Little Rock Church Rd
- 7374 Gourd Branch Rd