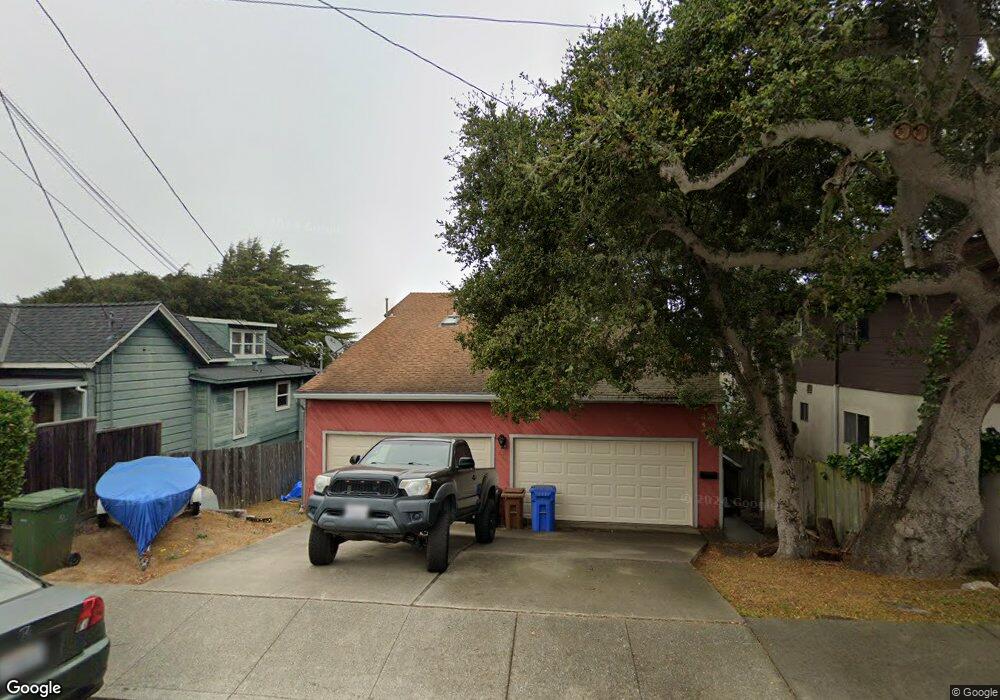
724 Pine St Monterey, CA 93940
New Monterey NeighborhoodEstimated Value: $1,287,000 - $1,810,349
4
Beds
4
Baths
2,880
Sq Ft
$513/Sq Ft
Est. Value
About This Home
This home is located at 724 Pine St, Monterey, CA 93940 and is currently estimated at $1,477,337, approximately $512 per square foot. 724 Pine St is a home located in Monterey County with nearby schools including Monte Vista Elementary School, Monte Vista Middle School, and Monterey High School.
Ownership History
Date
Name
Owned For
Owner Type
Purchase Details
Closed on
Mar 27, 2007
Sold by
Smith Michael Alden
Bought by
Smith Michael Alden and The Michael Alden Smith Trust
Current Estimated Value
Create a Home Valuation Report for This Property
The Home Valuation Report is an in-depth analysis detailing your home's value as well as a comparison with similar homes in the area
Home Values in the Area
Average Home Value in this Area
Purchase History
| Date | Buyer | Sale Price | Title Company |
|---|---|---|---|
| Smith Michael Alden | -- | None Available |
Source: Public Records
Mortgage History
| Date | Status | Borrower | Loan Amount |
|---|---|---|---|
| Closed | Smith Michael Alden | $635,000 | |
| Closed | Smith Michael Alden | $749,000 | |
| Closed | Smith Michael Alden | $225,000 | |
| Closed | Smith Michael Alden | $200,000 | |
| Closed | Smith Michael Alden | $225,000 |
Source: Public Records
Tax History Compared to Growth
Tax History
| Year | Tax Paid | Tax Assessment Tax Assessment Total Assessment is a certain percentage of the fair market value that is determined by local assessors to be the total taxable value of land and additions on the property. | Land | Improvement |
|---|---|---|---|---|
| 2025 | $3,348 | $304,905 | $152,381 | $152,524 |
| 2024 | $3,348 | $298,928 | $149,394 | $149,534 |
| 2023 | $3,241 | $293,067 | $146,465 | $146,602 |
| 2022 | $3,196 | $287,322 | $143,594 | $143,728 |
| 2021 | $3,149 | $281,689 | $140,779 | $140,910 |
| 2020 | $3,033 | $278,802 | $139,336 | $139,466 |
| 2019 | $3,174 | $273,336 | $136,604 | $136,732 |
| 2018 | $3,051 | $267,977 | $133,926 | $134,051 |
| 2017 | $2,832 | $262,723 | $131,300 | $131,423 |
| 2016 | $2,781 | $257,573 | $128,726 | $128,847 |
| 2015 | $2,742 | $253,705 | $126,793 | $126,912 |
| 2014 | $2,695 | $248,736 | $124,310 | $124,426 |
Source: Public Records
Map
Nearby Homes