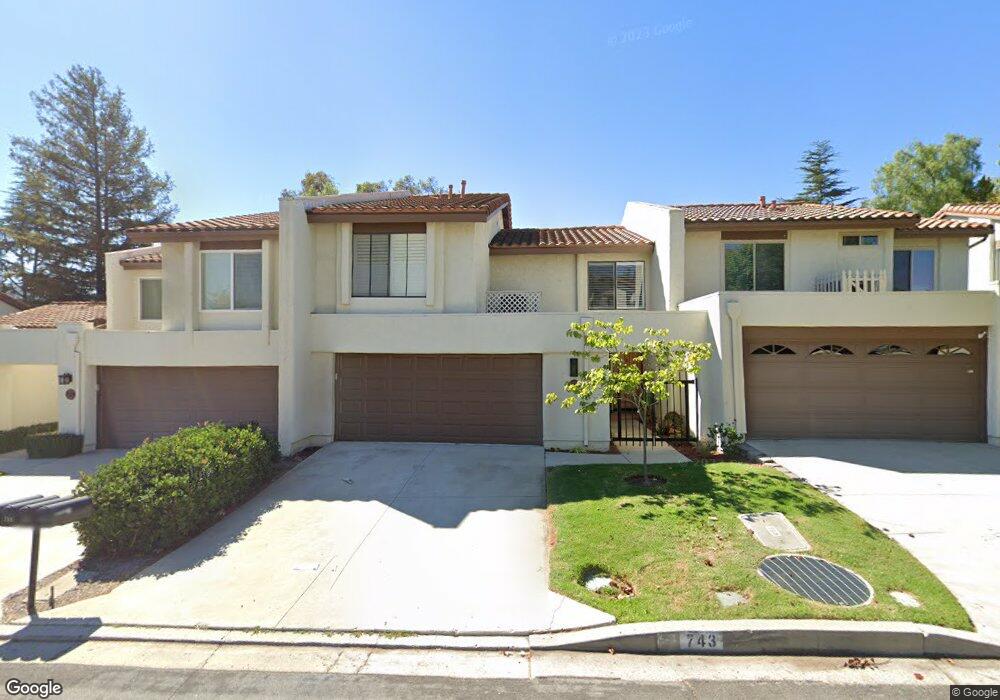
743 Shadow Lake Dr Thousand Oaks, CA 91360
Estimated Value: $791,000 - $877,000
3
Beds
3
Baths
1,950
Sq Ft
$429/Sq Ft
Est. Value
About This Home
This home is located at 743 Shadow Lake Dr, Thousand Oaks, CA 91360 and is currently estimated at $837,338, approximately $429 per square foot. 743 Shadow Lake Dr is a home located in Ventura County with nearby schools including Acacia Elementary School, Redwood Middle School, and Thousand Oaks High School.
Ownership History
Date
Name
Owned For
Owner Type
Purchase Details
Closed on
Oct 20, 2020
Sold by
Dome Stephen A
Bought by
Shadow Lake 743 Llc
Current Estimated Value
Purchase Details
Closed on
Aug 12, 2020
Sold by
Kyles Shawn and Shawn Kyles Living Trust
Bought by
Dome Stephen A
Purchase Details
Closed on
Jun 20, 2019
Sold by
Kyles Shawn
Bought by
Kyles Shawn and The Shawn Kyles Living Trust
Purchase Details
Closed on
Aug 15, 2011
Sold by
Schenkman Robert
Bought by
Kyles Shawn
Home Financials for this Owner
Home Financials are based on the most recent Mortgage that was taken out on this home.
Original Mortgage
$100,000
Interest Rate
4.43%
Mortgage Type
Seller Take Back
Create a Home Valuation Report for This Property
The Home Valuation Report is an in-depth analysis detailing your home's value as well as a comparison with similar homes in the area
Home Values in the Area
Average Home Value in this Area
Purchase History
| Date | Buyer | Sale Price | Title Company |
|---|---|---|---|
| Shadow Lake 743 Llc | -- | None Available | |
| Dome Stephen A | $632,500 | Consumers Title Company | |
| Kyles Shawn | -- | None Available | |
| Kyles Shawn | $225,000 | Lawyers Title |
Source: Public Records
Mortgage History
| Date | Status | Borrower | Loan Amount |
|---|---|---|---|
| Previous Owner | Kyles Shawn | $280,000 | |
| Previous Owner | Kyles Shawn | $100,000 | |
| Previous Owner | Schenkman Robert | $50,000 |
Source: Public Records
Tax History Compared to Growth
Tax History
| Year | Tax Paid | Tax Assessment Tax Assessment Total Assessment is a certain percentage of the fair market value that is determined by local assessors to be the total taxable value of land and additions on the property. | Land | Improvement |
|---|---|---|---|---|
| 2024 | $7,538 | $671,214 | $436,158 | $235,056 |
| 2023 | $7,319 | $658,053 | $427,605 | $230,448 |
| 2022 | $7,191 | $645,150 | $419,220 | $225,930 |
| 2021 | $7,070 | $632,500 | $411,000 | $221,500 |
| 2020 | $3,918 | $367,512 | $183,756 | $183,756 |
| 2019 | $3,815 | $360,306 | $180,153 | $180,153 |
| 2018 | $3,739 | $353,242 | $176,621 | $176,621 |
| 2017 | $3,667 | $346,316 | $173,158 | $173,158 |
| 2016 | $3,633 | $339,526 | $169,763 | $169,763 |
| 2015 | $3,570 | $334,428 | $167,214 | $167,214 |
| 2014 | $3,520 | $327,880 | $163,940 | $163,940 |
Source: Public Records
Map
Nearby Homes
- 603 Racquet Club Ln
- 813 Woodlawn Dr
- 720 Woodlawn Dr
- 616 Knollview Ln
- 427 Arbor Lane Ct Unit 101
- 769 Birchpark Cir Unit 203
- 769 Birchpark Cir Unit 207
- 758 Camino Dos Rios
- 1202 Monte Sereno Dr
- 1229 Monte Sereno Dr
- 348 Chestnut Hill Ct Unit 17
- 327 Chestnut Hill Ct Unit 22
- 324 Chestnut Hill Ct Unit 14
- 324 Chestnut Hill Ct Unit 16
- 428 Maidstone Ln
- 575 Spyglass Ln
- 286 Oak Leaf Dr Unit 24
- 245 Oakleaf Dr Unit 102
- 245 Oakleaf Dr Unit 205
- 743 Shadow Dr
- 739 Shadow Lake Dr
- 747 Shadow Lake Dr
- 731 Shadow Lake Dr
- 757 Shadow Lake Dr
- 763 Shadow Lake Dr
- 501 Hollyburne Ln
- 769 Shadow Lake Dr
- 725 Shadow Lake Dr
- 721 Shadow Lake Dr
- 775 Shadow Lake Dr
- 515 Hollyburne Ln
- 717 Shadow Lake Dr
- 675 Racquet Club Ln
- 783 Shadow Lake Dr
- 500 Hollyburne Ln
- 661 Racquet Club Ln
- 512 Hollyburne Ln
- 791 Shadow Lake Dr
- 711 Shadow Lake Dr