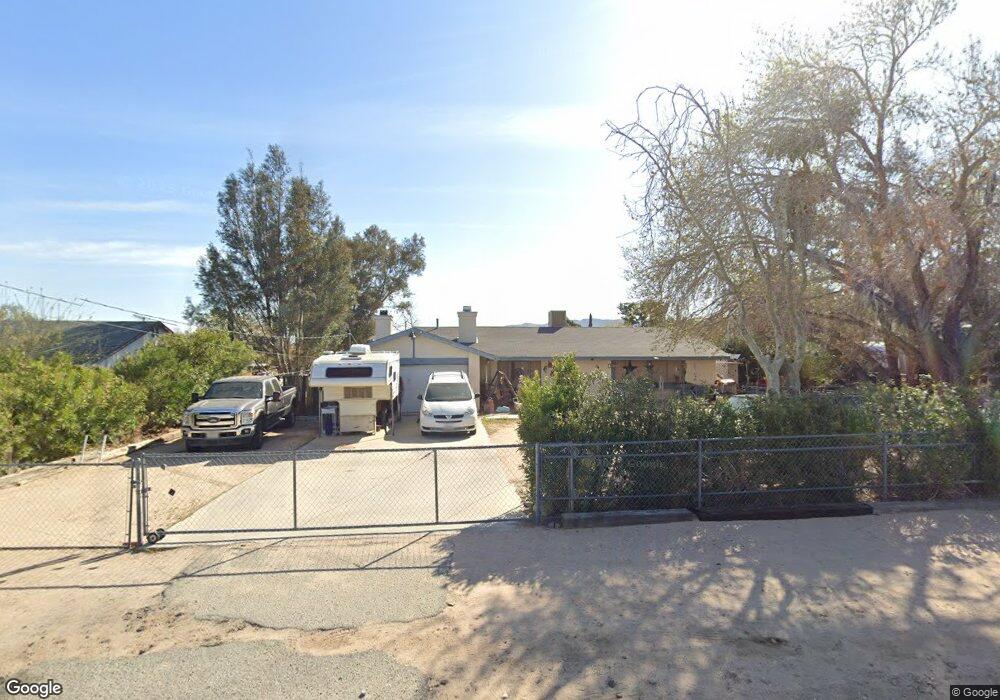
7609 Lyons Ave Hesperia, CA 92345
The Mesa NeighborhoodEstimated Value: $432,426 - $503,000
3
Beds
2
Baths
1,580
Sq Ft
$288/Sq Ft
Est. Value
About This Home
This home is located at 7609 Lyons Ave, Hesperia, CA 92345 and is currently estimated at $454,857, approximately $287 per square foot. 7609 Lyons Ave is a home located in San Bernardino County with nearby schools including Kingston Elementary School, Ranchero Middle School, and Sultana High School.
Ownership History
Date
Name
Owned For
Owner Type
Purchase Details
Closed on
Mar 2, 2020
Sold by
Daly John R and Fleming Daly Rhonda
Bought by
Daly John R and Fleming Daly Rhonda
Current Estimated Value
Home Financials for this Owner
Home Financials are based on the most recent Mortgage that was taken out on this home.
Original Mortgage
$189,200
Interest Rate
3.6%
Mortgage Type
New Conventional
Purchase Details
Closed on
Nov 19, 2004
Sold by
Daly John R
Bought by
Daly John R and Daly Rhonda G
Home Financials for this Owner
Home Financials are based on the most recent Mortgage that was taken out on this home.
Original Mortgage
$137,197
Interest Rate
5.72%
Mortgage Type
New Conventional
Purchase Details
Closed on
Jun 24, 1999
Sold by
Daly John R
Bought by
Daly John R and Fleming Daly Rhonda G
Home Financials for this Owner
Home Financials are based on the most recent Mortgage that was taken out on this home.
Original Mortgage
$103,275
Interest Rate
7.2%
Mortgage Type
FHA
Create a Home Valuation Report for This Property
The Home Valuation Report is an in-depth analysis detailing your home's value as well as a comparison with similar homes in the area
Home Values in the Area
Average Home Value in this Area
Purchase History
| Date | Buyer | Sale Price | Title Company |
|---|---|---|---|
| Daly John R | -- | Chicago Title Company | |
| Daly John R | -- | Fidelity Nationaltitle Co | |
| Daly John R | -- | Fidelity National Title |
Source: Public Records
Mortgage History
| Date | Status | Borrower | Loan Amount |
|---|---|---|---|
| Closed | Daly John R | $189,200 | |
| Closed | Daly John R | $137,197 | |
| Closed | Daly John R | $103,275 |
Source: Public Records
Tax History Compared to Growth
Tax History
| Year | Tax Paid | Tax Assessment Tax Assessment Total Assessment is a certain percentage of the fair market value that is determined by local assessors to be the total taxable value of land and additions on the property. | Land | Improvement |
|---|---|---|---|---|
| 2025 | $2,047 | $190,703 | $47,678 | $143,025 |
| 2024 | $2,047 | $186,964 | $46,743 | $140,221 |
| 2023 | $2,024 | $183,298 | $45,826 | $137,472 |
| 2022 | $2,048 | $179,703 | $44,927 | $134,776 |
| 2021 | $2,011 | $176,179 | $44,046 | $132,133 |
| 2020 | $1,916 | $174,372 | $43,594 | $130,778 |
| 2019 | $1,876 | $170,953 | $42,739 | $128,214 |
| 2018 | $1,839 | $167,601 | $41,901 | $125,700 |
| 2017 | $1,805 | $164,314 | $41,079 | $123,235 |
| 2016 | $1,766 | $161,093 | $40,274 | $120,819 |
| 2015 | $1,743 | $158,673 | $39,669 | $119,004 |
| 2014 | $1,718 | $155,565 | $38,892 | $116,673 |
Source: Public Records
Map
Nearby Homes
- 7535 Kenyon Ave
- 0 Newhall Ave Unit HD25223892
- 7681 Newhall Ave
- 0 Oxford Ave Unit HD25072687
- 7850 Lyons Ave
- 7885 Montrose Ave
- 0 Kenyon Ave
- 7610 Glider Ave
- 7336 Hastings Ave
- 17111 Ranchero St
- 7240 Lyons Ave
- 7991 Montrose Ave
- 8020 Newhall Ave
- 7486 Earhart Ave
- 17461 Preston St
- Residence Four Plan at Silverwood - Journey
- Residence Three Plan at Silverwood - Journey
- Residence One Plan at Silverwood - Journey
- Residence Two Plan at Silverwood - Journey
- 7331 I Ave
- 7625 Lyons Ave
- 7601 Lyons Ave
- 7634 Montrose Ave
- 7585 Lyons Ave
- 7641 Lyons Ave
- 7618 Montrose Ave
- 7648 Montrose Ave
- 7608 Lyons Ave
- 7624 Lyons Ave
- 7598 Lyons Ave
- 7602 Montrose Ave
- 7664 Montrose Ave
- 7657 Lyons Ave
- 7569 Lyons Ave
- 7640 Lyons Ave
- 7584 Lyons Ave
- 7586 Montrose Ave
- 7678 Montrose Ave
- 7656 Lyons Ave
- 7568 Lyons Ave