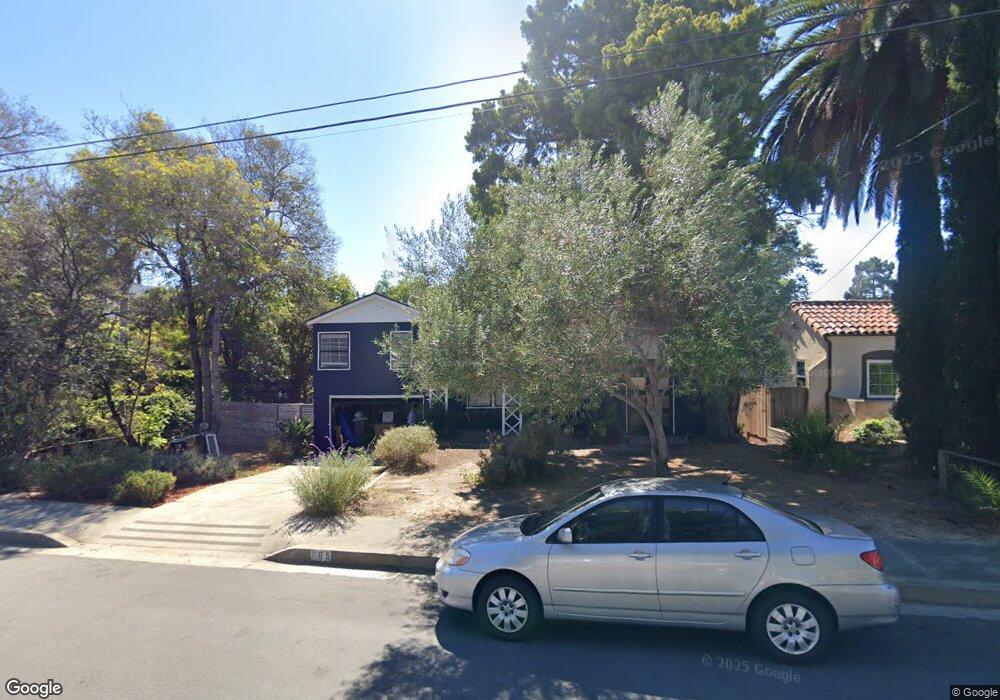
765 Center St San Luis Obispo, CA 93405
Foothill NeighborhoodEstimated Value: $1,126,746 - $1,584,000
3
Beds
2
Baths
1,560
Sq Ft
$822/Sq Ft
Est. Value
About This Home
This home is located at 765 Center St, San Luis Obispo, CA 93405 and is currently estimated at $1,281,687, approximately $821 per square foot. 765 Center St is a home located in San Luis Obispo County with nearby schools including Bishop's Peak Elementary School, Laguna Middle School, and San Luis Obispo High School.
Ownership History
Date
Name
Owned For
Owner Type
Purchase Details
Closed on
Aug 30, 2018
Sold by
Harwood Henry Sanford and Newman Amy M
Bought by
Harwood Henry Sanford and Newman Amy M
Current Estimated Value
Home Financials for this Owner
Home Financials are based on the most recent Mortgage that was taken out on this home.
Original Mortgage
$480,000
Outstanding Balance
$417,726
Interest Rate
4.5%
Mortgage Type
New Conventional
Estimated Equity
$863,961
Purchase Details
Closed on
Jan 30, 2001
Sold by
Cooper Kathleen M
Bought by
Harwood Henry S and Newman Amy M
Home Financials for this Owner
Home Financials are based on the most recent Mortgage that was taken out on this home.
Original Mortgage
$313,500
Interest Rate
7.12%
Create a Home Valuation Report for This Property
The Home Valuation Report is an in-depth analysis detailing your home's value as well as a comparison with similar homes in the area
Home Values in the Area
Average Home Value in this Area
Purchase History
| Date | Buyer | Sale Price | Title Company |
|---|---|---|---|
| Harwood Henry Sanford | -- | Pacific Coast Title Co | |
| Harwood Henry S | $330,000 | Cuesta Title Company |
Source: Public Records
Mortgage History
| Date | Status | Borrower | Loan Amount |
|---|---|---|---|
| Open | Harwood Henry Sanford | $480,000 | |
| Closed | Harwood Henry S | $313,500 |
Source: Public Records
Tax History Compared to Growth
Tax History
| Year | Tax Paid | Tax Assessment Tax Assessment Total Assessment is a certain percentage of the fair market value that is determined by local assessors to be the total taxable value of land and additions on the property. | Land | Improvement |
|---|---|---|---|---|
| 2025 | $5,765 | $532,085 | $256,152 | $275,933 |
| 2024 | $5,661 | $521,653 | $251,130 | $270,523 |
| 2023 | $5,661 | $511,425 | $246,206 | $265,219 |
| 2022 | $5,306 | $501,398 | $241,379 | $260,019 |
| 2021 | $5,222 | $491,568 | $236,647 | $254,921 |
| 2020 | $5,168 | $486,529 | $234,221 | $252,308 |
| 2019 | $5,115 | $476,990 | $229,629 | $247,361 |
| 2018 | $5,014 | $467,638 | $225,127 | $242,511 |
| 2017 | $4,916 | $458,469 | $220,713 | $237,756 |
| 2016 | $4,820 | $449,481 | $216,386 | $233,095 |
| 2015 | $4,746 | $442,730 | $213,136 | $229,594 |
| 2014 | $4,358 | $434,058 | $208,961 | $225,097 |
Source: Public Records
Map
Nearby Homes
- 644 Mountain View St
- 160 Broad St
- 670 Chorro St Unit D
- 680 Chorro St Unit 5
- 570 Peach St Unit 25
- 1143 Walnut St
- 1213 Murray Ave
- 664 Toro St
- 779 Toro St
- 783 Toro St
- 1214 Mill St
- 60 Casa St
- 1229 Mill St
- 45 Stenner St Unit H
- 879 Johnson Ave
- 1185 E Foothill Blvd Unit 25
- 581 Higuera St Unit 302
- 581 Higuera St Unit 207
- 581 Higuera St Unit 208
- 581 Higuera St Unit 301