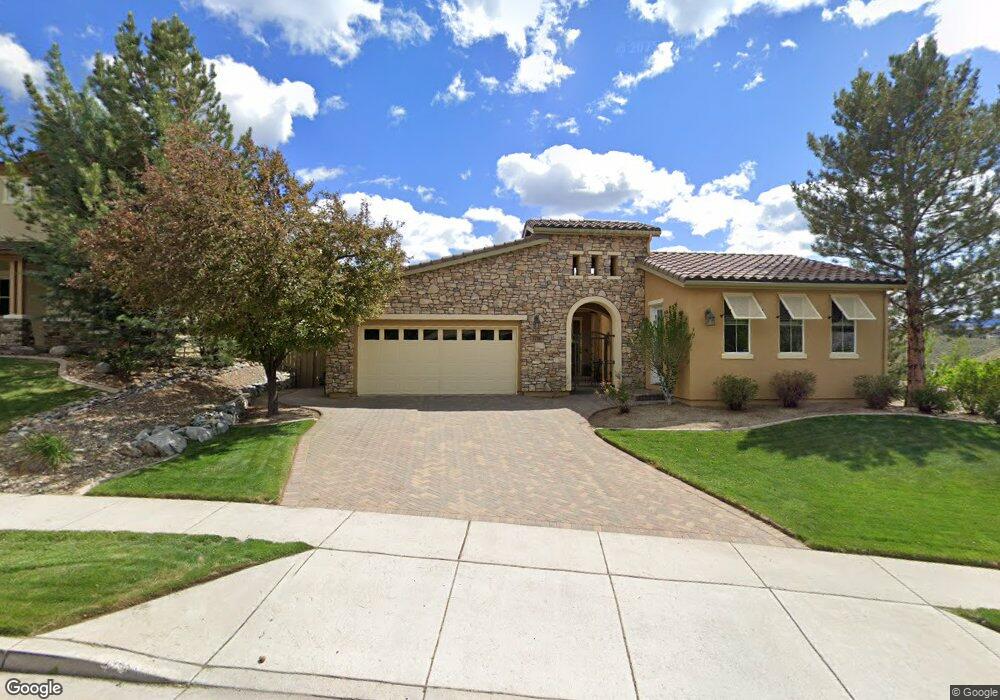
7750 Autumn Ridge Cir Reno, NV 89523
Somersett NeighborhoodEstimated Value: $912,111 - $1,061,000
3
Beds
3
Baths
2,660
Sq Ft
$370/Sq Ft
Est. Value
About This Home
This home is located at 7750 Autumn Ridge Cir, Reno, NV 89523 and is currently estimated at $984,778, approximately $370 per square foot. 7750 Autumn Ridge Cir is a home located in Washoe County with nearby schools including B D Billinghurst Middle School, Robert McQueen High School, and Riverview Christian Academy.
Ownership History
Date
Name
Owned For
Owner Type
Purchase Details
Closed on
Mar 3, 2021
Sold by
Dressel John E and Dressel Shannon M
Bought by
Dressel Family 2019 Trust
Current Estimated Value
Home Financials for this Owner
Home Financials are based on the most recent Mortgage that was taken out on this home.
Original Mortgage
$256,330
Interest Rate
2.7%
Mortgage Type
New Conventional
Purchase Details
Closed on
Jul 16, 2019
Sold by
Sarye Shannon M and Dressel Shannon M
Bought by
Dressel John E and Dressel Shannon M
Purchase Details
Closed on
Oct 19, 2004
Sold by
Copper Knolls Llc
Bought by
Sayre Shannon M
Home Financials for this Owner
Home Financials are based on the most recent Mortgage that was taken out on this home.
Original Mortgage
$325,000
Interest Rate
5.25%
Mortgage Type
Unknown
Create a Home Valuation Report for This Property
The Home Valuation Report is an in-depth analysis detailing your home's value as well as a comparison with similar homes in the area
Home Values in the Area
Average Home Value in this Area
Purchase History
| Date | Buyer | Sale Price | Title Company |
|---|---|---|---|
| Dressel Family 2019 Trust | -- | None Listed On Document | |
| Dressel John E | -- | None Listed On Document | |
| Dressel John E | -- | None Available | |
| Sayre Shannon M | $575,000 | Ticor Title Of Nevada Inc |
Source: Public Records
Mortgage History
| Date | Status | Borrower | Loan Amount |
|---|---|---|---|
| Previous Owner | Dressel John E | $256,330 | |
| Previous Owner | Dressel Shannon M | $279,500 | |
| Previous Owner | Sayre Shannon M | $325,000 |
Source: Public Records
Tax History Compared to Growth
Tax History
| Year | Tax Paid | Tax Assessment Tax Assessment Total Assessment is a certain percentage of the fair market value that is determined by local assessors to be the total taxable value of land and additions on the property. | Land | Improvement |
|---|---|---|---|---|
| 2025 | $4,972 | $230,942 | $80,903 | $150,039 |
| 2024 | $4,972 | $222,252 | $71,348 | $150,905 |
| 2023 | $4,828 | $219,904 | $77,175 | $142,729 |
| 2022 | $4,689 | $187,215 | $68,355 | $118,860 |
| 2021 | $4,551 | $174,282 | $56,228 | $118,054 |
| 2020 | $4,417 | $169,183 | $51,030 | $118,153 |
| 2019 | $4,288 | $164,579 | $50,820 | $113,759 |
| 2018 | $4,163 | $154,102 | $42,840 | $111,262 |
| 2017 | $4,042 | $148,574 | $37,275 | $111,299 |
| 2016 | $3,940 | $148,487 | $34,755 | $113,732 |
| 2015 | $3,924 | $143,008 | $29,400 | $113,608 |
| 2014 | $3,762 | $122,059 | $24,990 | $97,069 |
| 2013 | -- | $99,642 | $20,157 | $79,485 |
Source: Public Records
Map
Nearby Homes
- 7601 Autumn Ridge Cir
- 2195 Candle Rock Ct
- 2265 Peavine Valley Rd
- 2135 Hunter Glen Ct
- 2200 Peavine Creek Rd
- 2260 Peavine Creek Rd
- 1845 Dove Mountain Ct
- 1905 Dakota Ridge Trail
- 7680 Stone Bluff Way
- 1885 Dakota Ridge Trail
- 1672 Spring Hill Dr
- 1612 Sawtooth Trail
- 2350 Glen Eagles Dr
- 7609 Stone Bluff Way
- 1614 Spicewood Cir
- 2450 Painted River Trail
- 2595 Drake Wood Ct
- Plan 3 at Brae Retreat
- Plan 6 at Brae Retreat
- Plan 7 at Brae Retreat
- 7740 Autumn Ridge Cir
- 7790 Autumn Ridge Cir
- 7770 Autumn Ridge Cir
- 7741 Autumn Ridge Cir
- 7730 Autumn Ridge Cir
- 7731 Autumn Ridge Cir
- 7751 Autumn Ridge Cir
- 7720 Autumn Ridge Cir
- 7721 Autumn Ridge Cir
- 7761 Autumn Ridge Cir
- 7771 Autumn Ridge Cir
- 7791 Autumn Ridge Cir
- 7781 Autumn Ridge Cir
- 7710 Autumn Ridge Cir
- 7711 Autumn Ridge Cir
- 7870 Autumn Ridge Cir
- 7851 Autumn Ridge Cir
- 7690 Autumn Ridge Cir
- 7701 Autumn Ridge Cir
- 7880 Autumn Ridge Cir