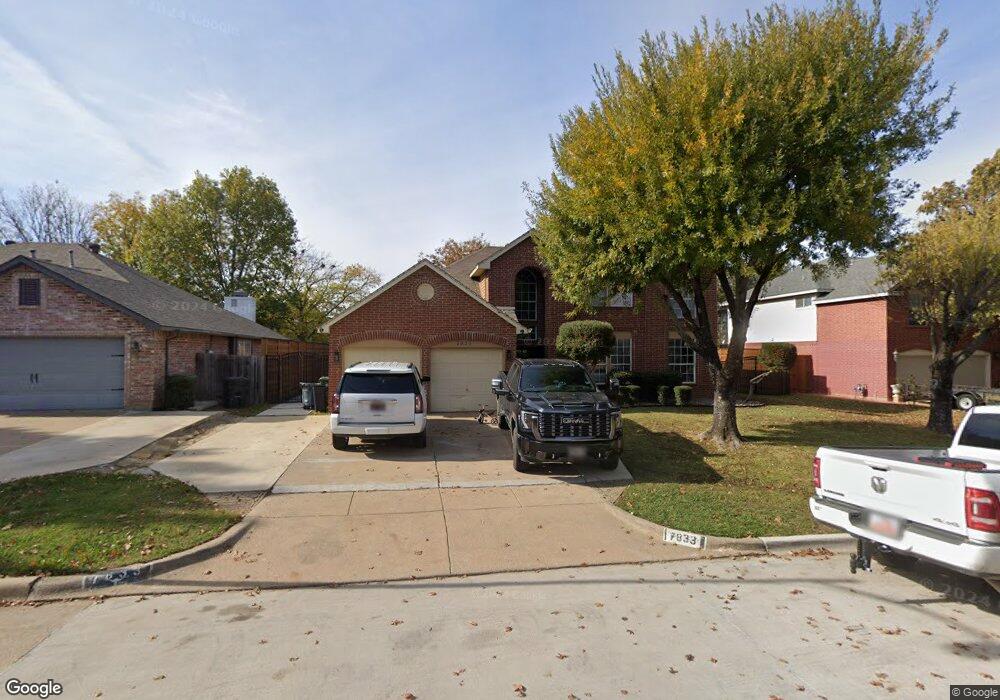
7833 Ember Oaks Dr North Richland Hills, TX 76182
Estimated Value: $449,198 - $509,000
4
Beds
2
Baths
2,399
Sq Ft
$195/Sq Ft
Est. Value
About This Home
This home is located at 7833 Ember Oaks Dr, North Richland Hills, TX 76182 and is currently estimated at $467,550, approximately $194 per square foot. 7833 Ember Oaks Dr is a home located in Tarrant County with nearby schools including Green Valley Elementary School, North Ridge Middle School, and Richland High School.
Ownership History
Date
Name
Owned For
Owner Type
Purchase Details
Closed on
Jun 14, 2005
Sold by
Pranivong Boun and Kingpetcharat Kamoltip
Bought by
Lopez Macario Delatorre and Delatorre Maria M
Current Estimated Value
Home Financials for this Owner
Home Financials are based on the most recent Mortgage that was taken out on this home.
Original Mortgage
$135,520
Interest Rate
5.76%
Mortgage Type
Fannie Mae Freddie Mac
Purchase Details
Closed on
Dec 5, 2000
Sold by
Schulien James Edward and Schulien Wendy Lynn
Bought by
Pranivong Boun and Kingpetcharat Kamoltip
Home Financials for this Owner
Home Financials are based on the most recent Mortgage that was taken out on this home.
Original Mortgage
$150,818
Interest Rate
7.72%
Mortgage Type
FHA
Create a Home Valuation Report for This Property
The Home Valuation Report is an in-depth analysis detailing your home's value as well as a comparison with similar homes in the area
Home Values in the Area
Average Home Value in this Area
Purchase History
| Date | Buyer | Sale Price | Title Company |
|---|---|---|---|
| Lopez Macario Delatorre | -- | First Land Title | |
| Pranivong Boun | -- | Alamo Title Company |
Source: Public Records
Mortgage History
| Date | Status | Borrower | Loan Amount |
|---|---|---|---|
| Open | Lopez Macario De La Torre | $181,200 | |
| Closed | Delatorre Macario | $13,912 | |
| Closed | Lopez Macario Delatorre | $135,520 | |
| Previous Owner | Pranivong Boun | $150,757 | |
| Previous Owner | Pranivong Boun | $150,818 |
Source: Public Records
Tax History Compared to Growth
Tax History
| Year | Tax Paid | Tax Assessment Tax Assessment Total Assessment is a certain percentage of the fair market value that is determined by local assessors to be the total taxable value of land and additions on the property. | Land | Improvement |
|---|---|---|---|---|
| 2024 | $7,004 | $410,770 | $75,000 | $335,770 |
| 2023 | $8,668 | $413,414 | $75,000 | $338,414 |
| 2022 | $8,644 | $359,206 | $45,000 | $314,206 |
| 2021 | $8,382 | $338,591 | $45,000 | $293,591 |
| 2020 | $7,619 | $299,442 | $45,000 | $254,442 |
| 2019 | $7,337 | $301,385 | $45,000 | $256,385 |
| 2018 | $6,084 | $253,289 | $45,000 | $208,289 |
| 2017 | $6,195 | $273,008 | $45,000 | $228,008 |
| 2016 | $5,632 | $233,781 | $35,000 | $198,781 |
| 2015 | $4,723 | $190,300 | $20,000 | $170,300 |
| 2014 | $4,723 | $190,300 | $20,000 | $170,300 |
Source: Public Records
Map
Nearby Homes
- 7901 Green Valley Dr
- 7924 Ember Oaks Dr
- 7828 Vineyard Ct
- 7925 Forest Lakes Dr
- 8428 Hidden Creek Ct
- 8424 Hidden Creek Ct
- 8012 Rushing Spring Dr
- 8100 Oak Knoll Dr
- 7800 Calvert Ln
- 7428 Park Place Dr
- 7420 Forrest Ln
- 7616 Ira Dr
- 8425 Patricks Path
- 8229 Forest Glenn
- 8116 Long Trail Dr
- 8424 Witt St
- 8517 Scottie St
- 8109 Starnes Rd
- 7620 Northfield Dr
- 7504 Oak Ridge Dr
- 7829 Ember Oaks Dr
- 7837 Ember Oaks Dr
- 7828 Forest Hills Ct
- 7824 Forest Hills Ct
- 7832 Forest Hills Ct
- 7832 Ember Oaks Dr
- 7825 Ember Oaks Dr
- 7828 Ember Oaks Dr
- 7841 Ember Oaks Dr
- 7836 Ember Oaks Dr
- 7820 Forest Hills Ct
- 7824 Ember Oaks Dr
- 7900 Forest Hills Ct
- 7840 Ember Oaks Dr
- 7840 Ember Oaks Dr
- 7821 Ember Oaks Dr
- 7816 Forest Hills Ct
- 7837 Clover Leaf Dr
- 7845 Ember Oaks Dr
- 7833 Clover Leaf Dr