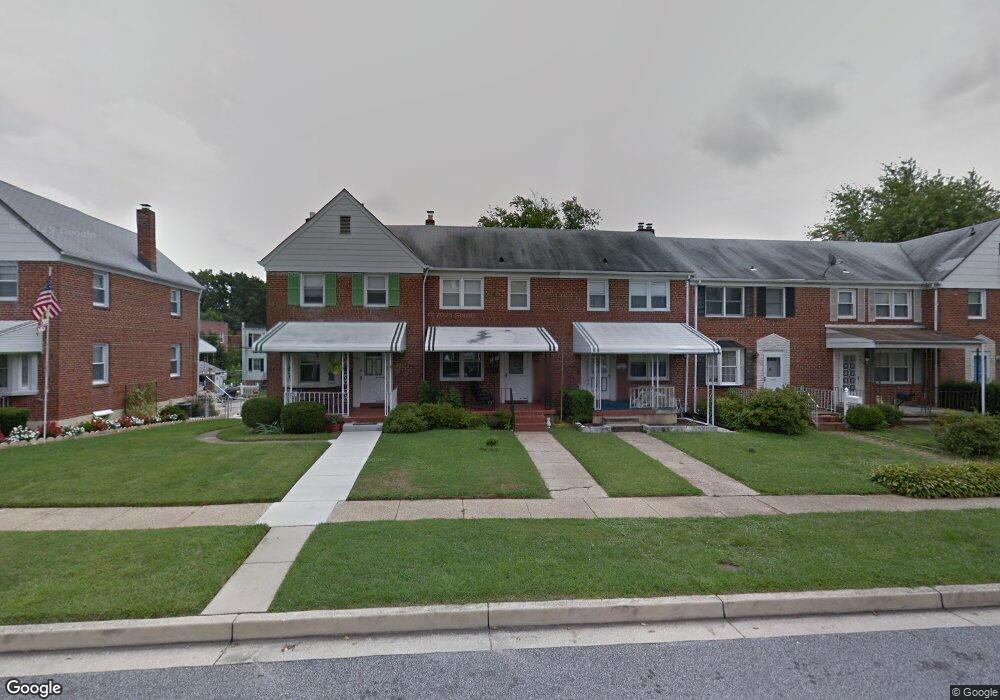
8651 Black Oak Rd Parkville, MD 21234
Estimated Value: $211,000 - $243,000
3
Beds
1
Bath
1,008
Sq Ft
$219/Sq Ft
Est. Value
About This Home
This home is located at 8651 Black Oak Rd, Parkville, MD 21234 and is currently estimated at $220,727, approximately $218 per square foot. 8651 Black Oak Rd is a home located in Baltimore County with nearby schools including Oakleigh Elementary School, Pine Grove Middle School, and Loch Raven High.
Ownership History
Date
Name
Owned For
Owner Type
Purchase Details
Closed on
Jul 27, 2010
Sold by
Rivera Nelson
Bought by
Clark Mark H
Current Estimated Value
Home Financials for this Owner
Home Financials are based on the most recent Mortgage that was taken out on this home.
Original Mortgage
$130,000
Outstanding Balance
$87,226
Interest Rate
4.76%
Mortgage Type
New Conventional
Estimated Equity
$133,501
Purchase Details
Closed on
Nov 3, 2005
Sold by
Hill Anthony F
Bought by
Rivera Nelson and Rivera Thamar
Home Financials for this Owner
Home Financials are based on the most recent Mortgage that was taken out on this home.
Original Mortgage
$133,600
Interest Rate
6.37%
Mortgage Type
Adjustable Rate Mortgage/ARM
Purchase Details
Closed on
Nov 30, 2001
Sold by
Beck Kathleen C
Bought by
Hill Anthony F and Hill Gwendolyn Y
Purchase Details
Closed on
Jun 18, 1998
Sold by
Cassady Kathleen A
Bought by
Beck Kathleen C and Beck Charles P
Create a Home Valuation Report for This Property
The Home Valuation Report is an in-depth analysis detailing your home's value as well as a comparison with similar homes in the area
Home Values in the Area
Average Home Value in this Area
Purchase History
| Date | Buyer | Sale Price | Title Company |
|---|---|---|---|
| Clark Mark H | $130,000 | -- | |
| Rivera Nelson | $167,000 | -- | |
| Hill Anthony F | $89,000 | -- | |
| Beck Kathleen C | -- | -- |
Source: Public Records
Mortgage History
| Date | Status | Borrower | Loan Amount |
|---|---|---|---|
| Open | Clark Mark H | $130,000 | |
| Previous Owner | Rivera Nelson | $195,787 | |
| Previous Owner | Rivera Nelson | $133,600 |
Source: Public Records
Tax History Compared to Growth
Tax History
| Year | Tax Paid | Tax Assessment Tax Assessment Total Assessment is a certain percentage of the fair market value that is determined by local assessors to be the total taxable value of land and additions on the property. | Land | Improvement |
|---|---|---|---|---|
| 2025 | $2,432 | $157,800 | $58,000 | $99,800 |
| 2024 | $2,432 | $149,533 | $0 | $0 |
| 2023 | $1,155 | $141,267 | $0 | $0 |
| 2022 | $2,208 | $133,000 | $58,000 | $75,000 |
| 2021 | $2,187 | $131,300 | $0 | $0 |
| 2020 | $2,187 | $129,600 | $0 | $0 |
| 2019 | $2,162 | $127,900 | $58,000 | $69,900 |
| 2018 | $2,104 | $126,367 | $0 | $0 |
| 2017 | $1,972 | $124,833 | $0 | $0 |
| 2016 | $2,018 | $123,300 | $0 | $0 |
| 2015 | $2,018 | $123,300 | $0 | $0 |
| 2014 | $2,018 | $123,300 | $0 | $0 |
Source: Public Records
Map
Nearby Homes
- 8663 Black Oak Rd
- 8625 Black Oak Rd
- 1801 Darrich Dr
- 1710 White Oak Ave
- 1719 Pin Oak Rd
- 8533 Chestnut Oak Rd
- 8718 Lackawanna Ave
- 8528 Chestnut Oak Rd
- 8520 Chestnut Oak Rd
- 1819 Redwood Ave
- 1755 Weston Ave
- 1814 Putty Hill Ave
- 8343 Ridgely Oak Rd
- 8678 Hoerner Ave
- 8302 Oakleigh Rd
- 1917 Putty Hill Ave
- 1666 Thetford Rd
- 1932 Rushley Rd
- 8519 Pleasant Plains Rd
- 1930 Mountain Ave
- 8649 Black Oak Rd
- 8653 Black Oak Rd
- 8647 Black Oak Rd
- 8655 Black Oak Rd
- 8645 Black Oak Rd
- 8657 Black Oak Rd
- 8643 Black Oak Rd
- 8659 Black Oak Rd
- 8661 Black Oak Rd
- 8654 Oak Rd
- 8652 Oak Rd
- 8656 Oak Rd
- 8658 Oak Rd
- 8650 Oak Rd
- 8660 Oak Rd
- 8639 Black Oak Rd
- 8648 Oak Rd
- 8662 Oak Rd
- 8646 Oak Rd
- 8665 Black Oak Rd