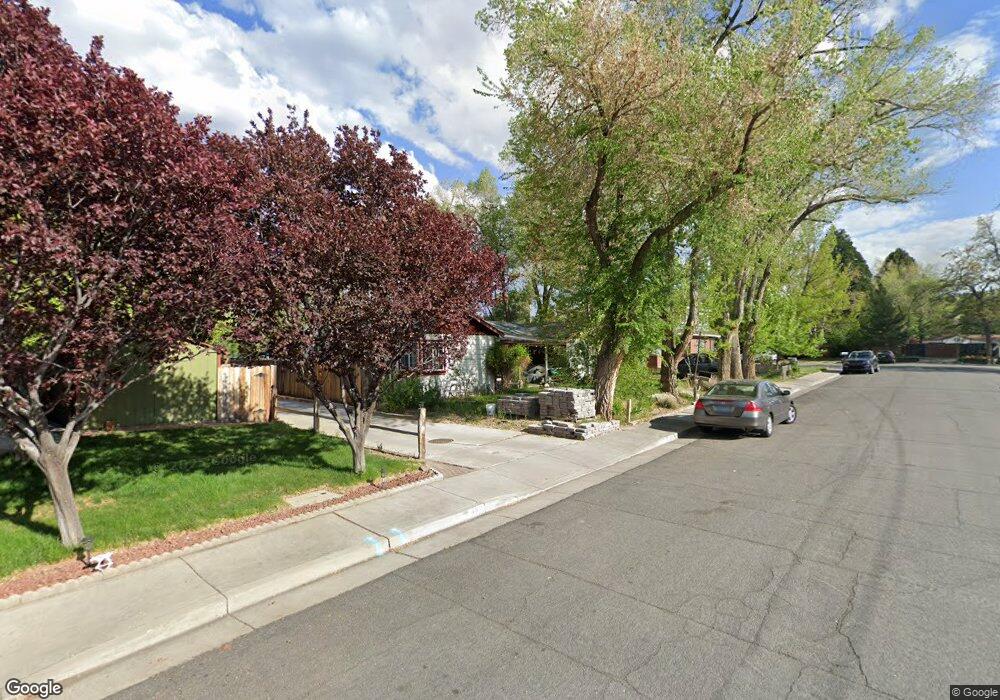
886 Lyman Ave Reno, NV 89509
Mayberry NeighborhoodEstimated Value: $653,000 - $679,711
3
Beds
2
Baths
1,679
Sq Ft
$394/Sq Ft
Est. Value
About This Home
This home is located at 886 Lyman Ave, Reno, NV 89509 and is currently estimated at $661,678, approximately $394 per square foot. 886 Lyman Ave is a home located in Washoe County with nearby schools including Hunter Lake Elementary School, Darrell C Swope Middle School, and Reno High School.
Ownership History
Date
Name
Owned For
Owner Type
Purchase Details
Closed on
Jan 14, 2016
Sold by
Mousset Jones Pierre F X and Mousset Jones Ethnea M
Bought by
Mousset Jones Living Trust
Current Estimated Value
Purchase Details
Closed on
Nov 4, 2015
Sold by
Mick Brian E and Mick Stefanie C
Bought by
Mousset Jones Pierre F X and Mousset Jones Ethnea M
Home Financials for this Owner
Home Financials are based on the most recent Mortgage that was taken out on this home.
Original Mortgage
$200,000
Outstanding Balance
$159,987
Interest Rate
3.81%
Mortgage Type
New Conventional
Estimated Equity
$499,006
Purchase Details
Closed on
Mar 30, 1998
Sold by
Ghilieri John and Ghilieri Kathi
Bought by
Mick Brian E and Mick Stefanie C
Home Financials for this Owner
Home Financials are based on the most recent Mortgage that was taken out on this home.
Original Mortgage
$135,900
Interest Rate
7%
Create a Home Valuation Report for This Property
The Home Valuation Report is an in-depth analysis detailing your home's value as well as a comparison with similar homes in the area
Home Values in the Area
Average Home Value in this Area
Purchase History
| Date | Buyer | Sale Price | Title Company |
|---|---|---|---|
| Mousset Jones Living Trust | -- | None Available | |
| Mousset Jones Pierre F X | $295,000 | Ticor Title Reno Lakeside | |
| Mick Brian E | $160,000 | Western Title Company Inc |
Source: Public Records
Mortgage History
| Date | Status | Borrower | Loan Amount |
|---|---|---|---|
| Open | Mousset Jones Pierre F X | $200,000 | |
| Previous Owner | Mick Brian | $75,000 | |
| Previous Owner | Mick Brian E | $86,000 | |
| Previous Owner | Mick Brian E | $131,900 | |
| Previous Owner | Mick Brian E | $135,900 |
Source: Public Records
Tax History Compared to Growth
Tax History
| Year | Tax Paid | Tax Assessment Tax Assessment Total Assessment is a certain percentage of the fair market value that is determined by local assessors to be the total taxable value of land and additions on the property. | Land | Improvement |
|---|---|---|---|---|
| 2025 | $2,773 | $115,124 | $51,504 | $63,620 |
| 2024 | $2,773 | $114,116 | $49,842 | $64,274 |
| 2023 | $0 | $110,271 | $49,343 | $60,928 |
| 2022 | $2,615 | $94,003 | $43,092 | $50,911 |
| 2021 | $2,540 | $80,730 | $29,925 | $50,805 |
| 2020 | $2,463 | $80,629 | $29,593 | $51,036 |
| 2019 | $2,392 | $75,652 | $26,234 | $49,418 |
| 2018 | $2,324 | $68,089 | $19,651 | $48,438 |
| 2017 | $2,200 | $68,254 | $19,651 | $48,603 |
| 2016 | $2,200 | $66,554 | $16,858 | $49,696 |
| 2015 | $1,103 | $62,711 | $13,001 | $49,710 |
| 2014 | $2,133 | $59,216 | $11,505 | $47,711 |
| 2013 | -- | $56,331 | $9,343 | $46,988 |
Source: Public Records
Map
Nearby Homes
- 1905 Von Way
- 1900 Marla Dr
- 700 Ferris Ln
- 615 Shamrock Ln
- 3175 Idlewild Dr
- 1510 Mayberry Dr
- 4000 Goodsell Ln
- 1755 Benjamin Franklin Dr
- 4180 Del Curto Dr
- 4090 Goodsell Ln
- 2195 W Plumb Ln
- 4184 Del Curto Dr
- 4060 Goodsell Ln
- 1435 Hunter Lake Dr
- 1725 Aquila Ave
- 1480 Hunter Lake Dr
- 2205 Keever Ct
- 1104 Ryegrass Ct
- 2875 Idlewild Dr Unit 91
- 2875 Idlewild Dr Unit 51