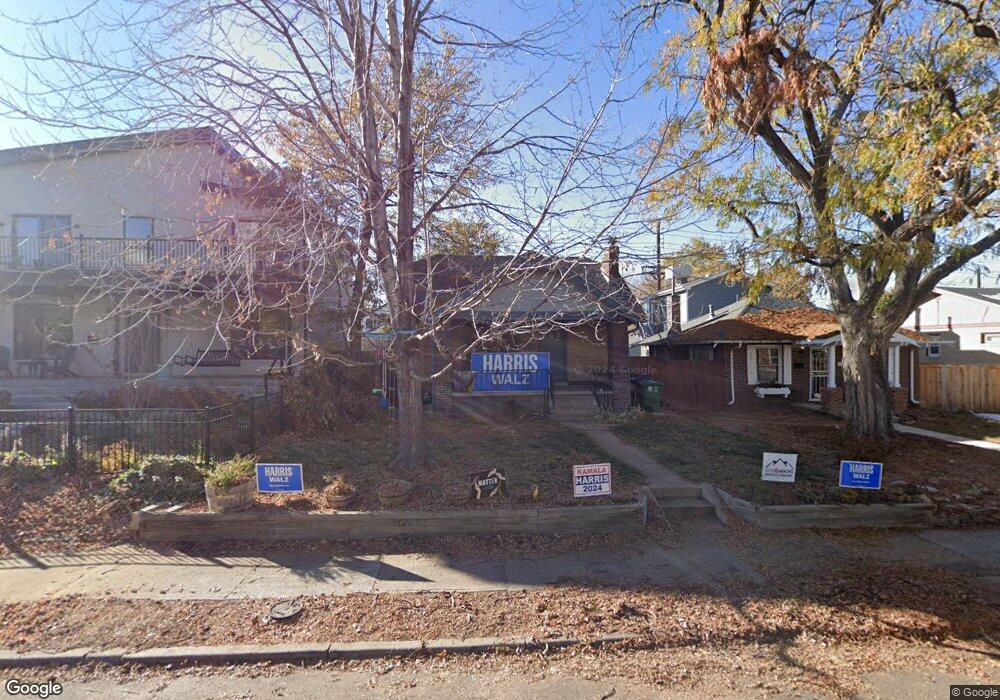
919 Harrison St Denver, CO 80206
Congress Park NeighborhoodEstimated Value: $727,854 - $833,000
2
Beds
2
Baths
1,260
Sq Ft
$622/Sq Ft
Est. Value
About This Home
This home is located at 919 Harrison St, Denver, CO 80206 and is currently estimated at $783,214, approximately $621 per square foot. 919 Harrison St is a home located in Denver County with nearby schools including Teller Elementary School, Morey Middle School, and East High School.
Ownership History
Date
Name
Owned For
Owner Type
Purchase Details
Closed on
Sep 26, 2000
Sold by
Lukin Kara R and Liggio Vincent J
Bought by
Lukin Kara R
Current Estimated Value
Home Financials for this Owner
Home Financials are based on the most recent Mortgage that was taken out on this home.
Original Mortgage
$145,000
Interest Rate
7.97%
Mortgage Type
Stand Alone First
Purchase Details
Closed on
Sep 25, 2000
Sold by
Lukin Kara R and Liggio Vincent J
Bought by
Lukin Kara R
Home Financials for this Owner
Home Financials are based on the most recent Mortgage that was taken out on this home.
Original Mortgage
$145,000
Interest Rate
7.97%
Mortgage Type
Stand Alone First
Purchase Details
Closed on
May 23, 1997
Sold by
France Richard E
Bought by
Lukin Kara R and Liggio Vincent J
Home Financials for this Owner
Home Financials are based on the most recent Mortgage that was taken out on this home.
Original Mortgage
$142,400
Interest Rate
8.17%
Create a Home Valuation Report for This Property
The Home Valuation Report is an in-depth analysis detailing your home's value as well as a comparison with similar homes in the area
Home Values in the Area
Average Home Value in this Area
Purchase History
| Date | Buyer | Sale Price | Title Company |
|---|---|---|---|
| Lukin Kara R | -- | -- | |
| Lukin Kara R | -- | -- | |
| Lukin Kara R | $149,900 | Land Title |
Source: Public Records
Mortgage History
| Date | Status | Borrower | Loan Amount |
|---|---|---|---|
| Open | Lukin Kara R | $117,500 | |
| Closed | Lukin Kara R | $144,650 | |
| Closed | Lukin Kara R | $153,000 | |
| Closed | Lukin Kara R | $150,250 | |
| Closed | Lukin Kara R | $147,373 | |
| Closed | Lukin Kara R | $145,000 | |
| Closed | Liggio Vincent J | $144,450 | |
| Closed | Lukin Kara R | $142,400 |
Source: Public Records
Tax History Compared to Growth
Tax History
| Year | Tax Paid | Tax Assessment Tax Assessment Total Assessment is a certain percentage of the fair market value that is determined by local assessors to be the total taxable value of land and additions on the property. | Land | Improvement |
|---|---|---|---|---|
| 2024 | $3,841 | $48,490 | $28,750 | $19,740 |
| 2023 | $3,757 | $48,490 | $28,750 | $19,740 |
| 2022 | $3,198 | $40,210 | $19,220 | $20,990 |
| 2021 | $3,087 | $41,370 | $19,780 | $21,590 |
| 2020 | $2,791 | $37,620 | $11,130 | $26,490 |
| 2019 | $2,713 | $37,620 | $11,130 | $26,490 |
| 2018 | $2,278 | $29,440 | $9,960 | $19,480 |
| 2017 | $2,271 | $29,440 | $9,960 | $19,480 |
| 2016 | $2,504 | $30,710 | $8,947 | $21,763 |
| 2015 | $2,399 | $30,710 | $8,947 | $21,763 |
| 2014 | $2,261 | $27,220 | $14,201 | $13,019 |
Source: Public Records
Map
Nearby Homes
- 900 Jackson St
- 848 Harrison St
- 1035 Colorado Blvd Unit 405
- 864 Garfield St
- 1053 Colorado Blvd
- 1100 Colorado Blvd Unit 305
- 1121 Albion St Unit 402
- 1121 Albion St Unit 210
- 1121 Albion St Unit 809
- 772 Garfield St
- 1137 Colorado Blvd
- 4110 Hale Pkwy Unit 5G
- 4110 Hale Pkwy Unit 3K
- 4110 Hale Pkwy Unit 5F
- 4110 Hale Pkwy Unit 3J
- 4110 Hale Pkwy Unit 1E
- 1155 Ash St Unit 1204
- 1155 Ash St Unit 1202
- 1155 Ash St Unit 1408
- 1155 Ash St Unit 1206
- 925 Harrison St
- 911 Harrison St
- 933 Harrison St
- 901 Harrison St
- 941 Harrison St
- 916 Jackson St
- 920 Jackson St
- 926 Jackson St
- 910 Jackson St
- 930 Jackson St
- 945 Harrison St
- 936 Jackson St
- 942 Jackson St
- 955 Harrison St
- 948 Jackson St
- 865 Harrison St
- 965 Harrison St
- 901 Colorado Blvd Unit FL2-ID584A
- 901 Colorado Blvd Unit FL2-ID585A
- 901 Colorado Blvd Unit FL1-ID514A