$456,654 - $600,000
RENTED JUL 1, 2024
2 Beds
1 Bath
2,600 Sq Ft
$207 Price per Sq Ft

Last Sold July 01, 2022

Last sale price $401,100 $154 Per Sq Ft

Est. 34% increase in value since last sale

Current estimated payment $3,529/month

About This Home

As of July 2022

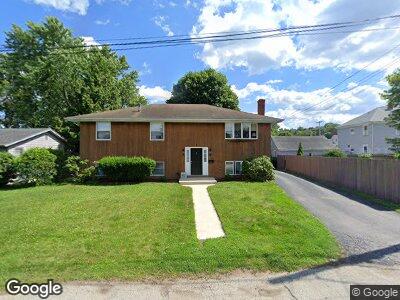
This home is located at 1 Grant St, Johnston, RI 02919 and is currently estimated at $537,414, approximately $206 per square foot. 1 Grant St is a home located in Providence County with nearby schools including Johnston Senior High School and St. Thomas Regional School.

Ownership History

Date Name Owned For Owner Type

Purchase Details

Listed on
May 27, 2022
Closed on
Jul 1, 2022
Sold by
Spunzo Frank and Spunzo Donna
Bought by
Gervacio Danlly
Seller's Agent
Kathy Bain Farrell
RE/MAX Town & Country
Buyer's Agent
Jarle Gervacio
BHHS Pinnacle Realty
List Price
$409,900
Sold Price
$401,100
Premium/Discount to List
-$8,800
-2.15%
Current Estimated Value
$537,414

Home Financials for this Owner

Home Financials are based on the most recent Mortgage that was taken out on this home.
Estimated Appreciation
$136,314
Avg. Annual Appreciation
10.93%
Original Mortgage
$387,713
Outstanding Balance
$372,982
Interest Rate
5.25%
Mortgage Type
FHA
Estimated Equity
$164,432

Purchase Details

Closed on
May 27, 1980
Bought by
Spunzo Frank and Spunzo Donna

Range of Values:

Collateral Analytics

Collateral Analytics Collateral Analytics AVMs (Automated Valuation Model) employ a number of statistical approaches combined with neighborhood-specific comparable selection guarantees the most up-to-date and precise valuations.

Not Available

Collateral Analytics does not have data for the current month. Please view the chart for historical values.

ICE

ICE Mortgage Technology ICE Mortgage Technology’s AVM (Automated Valuation Model) is a state-of-the-art online residential property valuation tool that provides a quick and accurate estimate of the value of almost any home in the U.S.

Not Available

ICE Mortgage Technology does not have data for the current month. Please view the chart for historical values.

First American

First American First American Data & Analytics’ next-generation AVM combines unrivaled data assets with a blended ensemble of valuation models to produce highly accurate, reliable valuations you can trust.

Not Available

First American does not have data for the current month. Please view the chart for historical values.

Quantarium

Quantarium Quantarium’s valuation service, repeatedly proven the industry’s most accurate and comprehensive, is supercharged with a self-learning and auto-tuning AI engine that continually becomes smarter and more accurate as it processes daily inputs from the industry’s leading RE data lake.

Not Available

Quantarium does not have data for the current month. Please view the chart for historical values.

Average Value
Not Available
List Price
Sold Price
Create a Home Valuation Report for This Property
The Home Valuation Report is an in-depth analysis detailing your home's value as well as a comparison with similar homes in the area

Home Values in the Area

Source: Public Records

Average Home Value in this Area


Source: Public Records

Purchase History

Date Buyer Sale Price Title Company
Gervacio Danlly $401,100 None Available
Spunzo Frank -- --
Source: Public Records

Mortgage History

Date Status Borrower Loan Amount
Open Gervacio Danlly $387,713
Previous Owner Spunzo Frank $40,000
Previous Owner Spunzo Frank $85,000
Previous Owner Spunzo Frank $75,000
Previous Owner Spunzo Frank $70,000
Source: Public Records

Property History

Date Event Price Change Sq Ft Price
07/01/2024 07/01/24 Rented $1,800 -10.0% --
06/11/2024 06/11/24 For Rent $2,000 0.0% --
07/01/2022 07/01/22 Sold $401,100 -2.1% $139 / Sq Ft
06/01/2022 06/01/22 Pending -- -- --
05/27/2022 05/27/22 For Sale $409,900 -- $142 / Sq Ft

Tax History Compared to Growth

Source: Public Records

Tax History

Year Tax Paid Tax Assessment Tax Assessment Total Assessment is a certain percentage of the fair market value that is determined by local assessors to be the total taxable value of land and additions on the property. Land Improvement
2024 $6,356 $415,400 $76,900 $338,500
2023 $6,356 $415,400 $76,900 $338,500
2022 $4,728 $270,500 $54,600 $215,900
2021 $6,286 $270,500 $54,600 $215,900
2018 $6,150 $223,700 $47,000 $176,700
2016 $8,136 $223,700 $47,000 $176,700
2015 $5,259 $181,400 $42,700 $138,700
2014 $3,022 $181,400 $42,700 $138,700
2013 $5,215 $181,400 $42,700 $138,700
Source: Public Records

Agents Affiliated with this Home

  • Section Image
  • Section Image
  • Section Image
See All Agents

Map