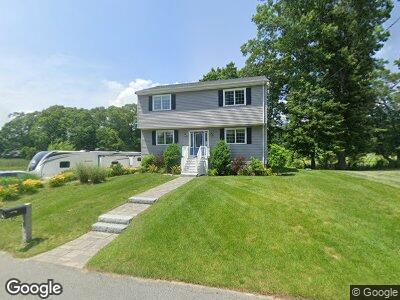
1 Lark Ln Assonet, MA 02702
Assonet Bay NeighborhoodEstimated Value: $517,053
3
Beds
2
Baths
1,800
Sq Ft
$287/Sq Ft
Est. Value
About This Home
This home is located at 1 Lark Ln, Assonet, MA 02702 and is currently estimated at $517,053, approximately $287 per square foot. 1 Lark Ln is a home located in Bristol County with nearby schools including Freetown Elementary School, George R Austin Intermediate School, and Freetown-Lakeville Middle School.
Ownership History
Date
Name
Owned For
Owner Type
Purchase Details
Closed on
Oct 17, 2018
Sold by
Cabral Craig J
Bought by
Sullivan Michael J and Sullivan Beth A
Current Estimated Value
Home Financials for this Owner
Home Financials are based on the most recent Mortgage that was taken out on this home.
Original Mortgage
$264,000
Interest Rate
4.5%
Mortgage Type
New Conventional
Purchase Details
Closed on
Dec 1, 2016
Sold by
Fnma
Bought by
Cabral Craig J
Purchase Details
Closed on
Aug 5, 2016
Sold by
Jenson Carol R
Bought by
Federal National Mortgage Association
Purchase Details
Closed on
Oct 16, 2003
Sold by
Jenson Carol R and Lawless Carol Rose
Bought by
Jenson Carol R
Home Financials for this Owner
Home Financials are based on the most recent Mortgage that was taken out on this home.
Original Mortgage
$112,000
Interest Rate
6.43%
Mortgage Type
Purchase Money Mortgage
Purchase Details
Closed on
Apr 30, 1976
Bought by
Jenson Carol R
Create a Home Valuation Report for This Property
The Home Valuation Report is an in-depth analysis detailing your home's value as well as a comparison with similar homes in the area
Home Values in the Area
Average Home Value in this Area
Purchase History
| Date | Buyer | Sale Price | Title Company |
|---|---|---|---|
| Sullivan Michael J | $330,000 | -- | |
| Cabral Craig J | $60,225 | -- | |
| Federal National Mortgage Association | $85,200 | -- | |
| Jenson Carol R | -- | -- | |
| Jenson Carol R | $5,000 | -- |
Source: Public Records
Mortgage History
| Date | Status | Borrower | Loan Amount |
|---|---|---|---|
| Open | Sullivan Michael J | $200,000 | |
| Closed | Sullivan Michael J | $264,000 | |
| Previous Owner | Jenson Carol R | $143,000 | |
| Previous Owner | Jenson Carol R | $30,000 | |
| Previous Owner | Jenson Carol R | $112,000 | |
| Previous Owner | Jenson Carol R | $25,000 |
Source: Public Records
Tax History Compared to Growth
Tax History
| Year | Tax Paid | Tax Assessment Tax Assessment Total Assessment is a certain percentage of the fair market value that is determined by local assessors to be the total taxable value of land and additions on the property. | Land | Improvement |
|---|---|---|---|---|
| 2025 | $0 | $464,900 | $171,000 | $293,900 |
| 2024 | $4,835 | $441,900 | $161,300 | $280,600 |
| 2023 | $0 | $420,600 | $145,200 | $275,400 |
| 2022 | $4,835 | $415,000 | $123,000 | $292,000 |
| 2021 | $0 | $380,700 | $111,900 | $268,800 |
| 2020 | $4,862 | $373,400 | $107,600 | $265,800 |
| 2019 | $3,637 | $276,600 | $102,500 | $174,100 |
| 2018 | $0 | $173,500 | $102,500 | $71,000 |
| 2017 | $2,267 | $170,200 | $102,500 | $67,700 |
| 2016 | $2,176 | $166,200 | $99,500 | $66,700 |
| 2015 | $2,113 | $163,800 | $99,500 | $64,300 |
| 2014 | $1,990 | $157,800 | $97,500 | $60,300 |
Source: Public Records