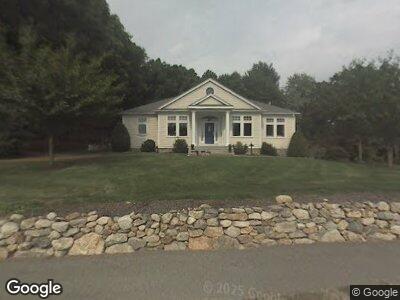
1 Myers Ln Burlington, MA 01803
Woods Corner NeighborhoodEstimated Value: $948,000 - $1,310,000
4
Beds
4
Baths
4,116
Sq Ft
$270/Sq Ft
Est. Value
About This Home
This home is located at 1 Myers Ln, Burlington, MA 01803 and is currently estimated at $1,112,622, approximately $270 per square foot. 1 Myers Ln is a home located in Middlesex County with nearby schools including Burlington High School, Memorial Elementary School, and Marshall Simonds Middle School.
Ownership History
Date
Name
Owned For
Owner Type
Purchase Details
Closed on
Apr 3, 2023
Sold by
Morcos Wagih S
Bought by
Wagih S Morcos Ret and Morcos
Current Estimated Value
Purchase Details
Closed on
Jun 16, 2000
Sold by
Inrahim Abdo K
Bought by
Morcos Wagih S and Lehtinen Wendy G
Home Financials for this Owner
Home Financials are based on the most recent Mortgage that was taken out on this home.
Original Mortgage
$213,750
Interest Rate
8.24%
Mortgage Type
Purchase Money Mortgage
Purchase Details
Closed on
Apr 27, 1989
Sold by
Dichio Anthony
Bought by
Ibrahim Abdo K
Home Financials for this Owner
Home Financials are based on the most recent Mortgage that was taken out on this home.
Original Mortgage
$125,000
Interest Rate
10.9%
Mortgage Type
Purchase Money Mortgage
Create a Home Valuation Report for This Property
The Home Valuation Report is an in-depth analysis detailing your home's value as well as a comparison with similar homes in the area
Home Values in the Area
Average Home Value in this Area
Purchase History
| Date | Buyer | Sale Price | Title Company |
|---|---|---|---|
| Wagih S Morcos Ret | -- | None Available | |
| Morcos Wagih S | $285,000 | -- | |
| Ibrahim Abdo K | $260,000 | -- | |
| Ibrahim Abdo K | $260,000 | -- |
Source: Public Records
Mortgage History
| Date | Status | Borrower | Loan Amount |
|---|---|---|---|
| Previous Owner | Morcos Wagih S | $200,000 | |
| Previous Owner | Morcos Wagih S | $214,000 | |
| Previous Owner | Morcos Wagih S | $214,000 | |
| Previous Owner | Ibrahim Abdo K | $214,000 | |
| Previous Owner | Ibrahim Abdo K | $213,750 | |
| Previous Owner | Ibrahim Abdo K | $125,000 |
Source: Public Records
Tax History Compared to Growth
Tax History
| Year | Tax Paid | Tax Assessment Tax Assessment Total Assessment is a certain percentage of the fair market value that is determined by local assessors to be the total taxable value of land and additions on the property. | Land | Improvement |
|---|---|---|---|---|
| 2025 | $7,330 | $846,400 | $383,100 | $463,300 |
| 2024 | $7,216 | $807,200 | $353,400 | $453,800 |
| 2023 | $7,044 | $749,400 | $306,500 | $442,900 |
| 2022 | $6,861 | $689,500 | $283,100 | $406,400 |
| 2021 | $6,601 | $663,400 | $257,000 | $406,400 |
| 2020 | $6,352 | $658,900 | $252,500 | $406,400 |
| 2019 | $6,119 | $583,900 | $230,000 | $353,900 |
| 2018 | $12,942 | $559,000 | $219,200 | $339,800 |
| 2017 | $5,927 | $559,000 | $219,200 | $339,800 |
| 2016 | $5,908 | $515,500 | $189,500 | $326,000 |
| 2015 | $5,851 | $515,500 | $189,500 | $326,000 |
| 2014 | $5,779 | $481,600 | $180,500 | $301,100 |
Source: Public Records
Map
Nearby Homes
- 58 Muller Rd
- 1 Reserve Way Unit B
- 4 Reserve Way Unit A
- 8 Kendalls Mill
- 5 Kendalls Mill
- 3 Myrna Rd
- 23 Thoreau Rd
- 5 Grant St
- 23 Burroughs Rd
- 44 Sylvanus Wood Ln
- 3 Brown Rd
- 14 Doran Farm Ln
- 20 Douglas Rd
- 197 Grant St
- 2 Muster Ct
- 22 Anna Rd
- 165 Cambridge Rd Unit 4
- 165 Cambridge Rd Unit 10
- 94 Cambridge Rd
- 299 Lexington St Unit 104