
Seller's Agent in 2025
Haley Paster Scimone
Sagan Harborside Sotheby's International Realty
(781) 367-5523
57 in this area
91 Total Sales
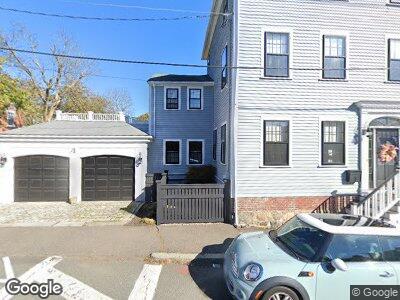
Live in the heart of downtown Marblehead in this elegant single-family home, where historic charm meets modern convenience. Boasting 4 bedrooms, 3 baths, and a rare two-car attached garage, this home offers the perfect combination of space and sophistication. Enjoy multiple outdoor spaces, including a rooftop deck, brick patio, and a beautifully landscaped yard, ideal for relaxing or entertaining. The thoughtfully updated interiors preserve the home’s timeless character while offering all the amenities for today’s lifestyle. Located just steps from Marblehead’s vibrant shops, restaurants, and more, this home is truly one of a kind and a must-see for anyone seeking comfort, style, and convenience.
| Date | Buyer | Sale Price | Title Company |
|---|---|---|---|
| Martin Gregory R | $665,000 | -- |
| Date | Status | Borrower | Loan Amount |
|---|---|---|---|
| Open | Bhns Llc | $1,350,000 | |
| Closed | Bhns Llc | $1,350,000 | |
| Closed | Martin Gregory R | $275,000 | |
| Closed | Martin Gregory R | $727,000 | |
| Closed | Martin Gregory R | $735,000 | |
| Closed | Martin Gregory R | $465,500 | |
| Previous Owner | Mcnulty Thomas A | $35,000 |
| Date | Event | Price | Change | Sq Ft Price |
|---|---|---|---|---|
| 04/01/2025 04/01/25 | Rented | $8,950 | 0.0% | -- |
| 03/31/2025 03/31/25 | Under Contract | -- | -- | -- |
| 01/09/2025 01/09/25 | For Rent | $8,950 | +2.3% | -- |
| 03/12/2024 03/12/24 | Rented | $8,750 | 0.0% | -- |
| 03/08/2024 03/08/24 | Under Contract | -- | -- | -- |
| 03/05/2024 03/05/24 | For Rent | $8,750 | +2.9% | -- |
| 10/20/2022 10/20/22 | Rented | $8,500 | -99.5% | -- |
| 10/17/2022 10/17/22 | Under Contract | -- | -- | -- |
| 09/30/2022 09/30/22 | Sold | $1,800,000 | 0.0% | $511 / Sq Ft |
| 09/03/2022 09/03/22 | For Rent | $8,500 | 0.0% | -- |
| 08/19/2022 08/19/22 | Pending | -- | -- | -- |
| 08/16/2022 08/16/22 | For Sale | $1,850,000 | +178.2% | $525 / Sq Ft |
| 12/16/2013 12/16/13 | Sold | $665,000 | +6.4% | $189 / Sq Ft |
| 11/16/2013 11/16/13 | Pending | -- | -- | -- |
| 10/14/2013 10/14/13 | For Sale | $625,000 | -- | $177 / Sq Ft |
| Year | Tax Paid | Tax Assessment Tax Assessment Total Assessment is a certain percentage of the fair market value that is determined by local assessors to be the total taxable value of land and additions on the property. | Land | Improvement |
|---|---|---|---|---|
| 2025 | $15,958 | $1,763,300 | $699,700 | $1,063,600 |
| 2024 | $15,571 | $1,737,800 | $699,700 | $1,038,100 |
| 2023 | $12,659 | $1,265,900 | $602,800 | $663,100 |
| 2022 | $11,182 | $1,062,900 | $538,300 | $524,600 |
| 2021 | $10,926 | $1,048,600 | $527,500 | $521,100 |
| 2020 | $10,263 | $987,800 | $516,700 | $471,100 |
| 2019 | $10,262 | $955,500 | $484,400 | $471,100 |
| 2018 | $9,937 | $901,700 | $430,600 | $471,100 |
| 2017 | $9,691 | $880,200 | $409,100 | $471,100 |
| 2016 | $9,317 | $839,400 | $366,000 | $473,400 |
| 2015 | $8,793 | $793,600 | $344,500 | $449,100 |
| 2014 | $7,120 | $642,000 | $344,500 | $297,500 |
Seller's Agent in 2025
Haley Paster Scimone
Sagan Harborside Sotheby's International Realty
(781) 367-5523
57 in this area
91 Total Sales
B
Seller's Agent in 2022
Brian Skidmore
RE/MAX
(617) 834-3227
10 in this area
13 Total Sales
J
Buyer's Agent in 2022
Juliano Amado
Laer Realty
A
Seller's Agent in 2013
All Marblehead
William Raveis R.E. & Home Services