Estimated Value: $299,000 - $381,000
--
Bed
--
Bath
1,824
Sq Ft
$186/Sq Ft
Est. Value
About This Home
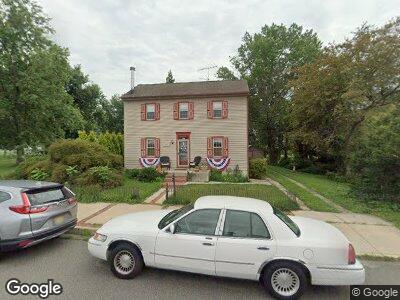
This home is located at 10 Lake St, Mullica Hill, NJ 08062 and is currently estimated at $340,175, approximately $186 per square foot. 10 Lake St is a home with nearby schools including South Harrison Township Elementary School, Kingsway Regional Middle School, and Kingsway Reg High School.
Ownership History
Date
Name
Owned For
Owner Type
Purchase Details
Closed on
Feb 16, 2021
Sold by
Blistan Robert Louis and Blistan Marie E
Bought by
Andrioli Alexandria J and Tottser Alex R
Current Estimated Value
Home Financials for this Owner
Home Financials are based on the most recent Mortgage that was taken out on this home.
Original Mortgage
$237,405
Outstanding Balance
$217,125
Interest Rate
2.7%
Mortgage Type
New Conventional
Estimated Equity
$156,255
Purchase Details
Closed on
Jul 31, 2013
Sold by
Rearick Marie E
Bought by
Blistan Marie E and Robert Louis
Purchase Details
Closed on
May 21, 1998
Sold by
Blistan Robert Louis
Bought by
Rearick Marie E
Home Financials for this Owner
Home Financials are based on the most recent Mortgage that was taken out on this home.
Original Mortgage
$30,000
Interest Rate
7.49%
Mortgage Type
Purchase Money Mortgage
Create a Home Valuation Report for This Property
The Home Valuation Report is an in-depth analysis detailing your home's value as well as a comparison with similar homes in the area
Home Values in the Area
Average Home Value in this Area
Purchase History
| Date | Buyer | Sale Price | Title Company |
|---|---|---|---|
| Andrioli Alexandria J | $249,900 | First American Mortgage Sln | |
| Blistan Marie E | -- | -- | |
| Rearick Marie E | $98,000 | Credit Lenders Title Agency |
Source: Public Records
Mortgage History
| Date | Status | Borrower | Loan Amount |
|---|---|---|---|
| Open | Andrioli Alexandria J | $237,405 | |
| Previous Owner | Blistan Robert L | $100,000 | |
| Previous Owner | Blistan Marie E | $75,000 | |
| Previous Owner | Blistan Robert L | $84,300 | |
| Previous Owner | Blistan Marie E | $90,000 | |
| Previous Owner | Rearick Marie E | $30,000 |
Source: Public Records
Tax History Compared to Growth
Tax History
| Year | Tax Paid | Tax Assessment Tax Assessment Total Assessment is a certain percentage of the fair market value that is determined by local assessors to be the total taxable value of land and additions on the property. | Land | Improvement |
|---|---|---|---|---|
| 2024 | $5,736 | $189,800 | $67,500 | $122,300 |
| 2023 | $5,736 | $189,800 | $67,500 | $122,300 |
| 2022 | $5,595 | $189,800 | $67,500 | $122,300 |
| 2021 | $5,554 | $189,800 | $67,500 | $122,300 |
| 2020 | $5,529 | $189,800 | $67,500 | $122,300 |
| 2019 | $5,605 | $189,800 | $67,500 | $122,300 |
| 2018 | $5,519 | $189,800 | $67,500 | $122,300 |
| 2017 | $5,438 | $189,800 | $67,500 | $122,300 |
| 2016 | $5,335 | $188,100 | $67,500 | $120,600 |
| 2015 | $5,301 | $188,100 | $67,500 | $120,600 |
| 2014 | $5,073 | $188,100 | $67,500 | $120,600 |
Source: Public Records
Map
Nearby Homes
- 22 Lake St
- 801 Mullica Hill Rd
- 673 Harrisonville Rd
- 93 Lincoln Mill Rd
- 23 Willowbrook Ln
- 424 Lincoln Rd
- 332 Whig Lane Rd
- 812 Lincoln Rd
- L5 Whig Lane Rd
- 266 Whig Lane Rd
- 578 Eldridges Hill Rd
- 19 Sweet Briar Ct
- 107 Foxford Ln
- 39 Fox Haven Ln
- 301 Fox Run Ct
- 64 Vestry Rd
- 167 Ashwood Dr
- 54 Vestry Rd
- 705 Franklinville Rd
- 81 Stewart Rd