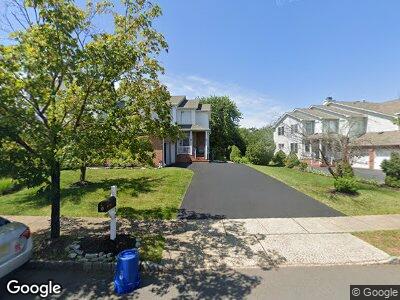
10 Newell St Hillsborough, NJ 08844
Heritage NeighborhoodEstimated Value: $726,795 - $820,000
--
Bed
--
Bath
2,274
Sq Ft
$333/Sq Ft
Est. Value
About This Home
This home is located at 10 Newell St, Hillsborough, NJ 08844 and is currently estimated at $758,199, approximately $333 per square foot. 10 Newell St is a home located in Somerset County with nearby schools including Hillsborough High School, Brighthorizons at Hillsborough, and Cherry Blossom Montessori School.
Ownership History
Date
Name
Owned For
Owner Type
Purchase Details
Closed on
Dec 30, 2022
Sold by
Sethuraman Venkat and Sethuraman Seema
Bought by
Wang Jing and Kulabkar Apurva N
Current Estimated Value
Home Financials for this Owner
Home Financials are based on the most recent Mortgage that was taken out on this home.
Original Mortgage
$495,200
Outstanding Balance
$481,193
Interest Rate
5.13%
Mortgage Type
New Conventional
Estimated Equity
$276,081
Purchase Details
Closed on
Aug 17, 2005
Sold by
Smith John
Bought by
Sethuraman Venkat and Betigeri Seema
Home Financials for this Owner
Home Financials are based on the most recent Mortgage that was taken out on this home.
Original Mortgage
$372,000
Interest Rate
5.81%
Purchase Details
Closed on
Nov 17, 1998
Sold by
Heritage Green Deve
Bought by
Smith John and Smith Diana
Home Financials for this Owner
Home Financials are based on the most recent Mortgage that was taken out on this home.
Original Mortgage
$161,820
Interest Rate
6.65%
Create a Home Valuation Report for This Property
The Home Valuation Report is an in-depth analysis detailing your home's value as well as a comparison with similar homes in the area
Home Values in the Area
Average Home Value in this Area
Purchase History
| Date | Buyer | Sale Price | Title Company |
|---|---|---|---|
| Wang Jing | $619,000 | Mega Title | |
| Sethuraman Venkat | $465,000 | -- | |
| Smith John | $202,275 | -- |
Source: Public Records
Mortgage History
| Date | Status | Borrower | Loan Amount |
|---|---|---|---|
| Open | Wang Jing | $495,200 | |
| Previous Owner | Sethuraman Venkat | $340,000 | |
| Previous Owner | Sethuraman Venkat | $372,000 | |
| Previous Owner | Smith John | $161,820 |
Source: Public Records
Tax History Compared to Growth
Tax History
| Year | Tax Paid | Tax Assessment Tax Assessment Total Assessment is a certain percentage of the fair market value that is determined by local assessors to be the total taxable value of land and additions on the property. | Land | Improvement |
|---|---|---|---|---|
| 2024 | $12,644 | $590,000 | $373,900 | $216,100 |
| 2023 | $11,613 | $539,400 | $323,900 | $215,500 |
| 2022 | $11,786 | $527,800 | $313,900 | $213,900 |
| 2021 | $11,256 | $479,500 | $263,900 | $215,600 |
| 2020 | $11,102 | $465,700 | $248,900 | $216,800 |
| 2019 | $10,741 | $446,800 | $228,900 | $217,900 |
| 2018 | $10,428 | $431,100 | $208,900 | $222,200 |
| 2017 | $10,290 | $426,100 | $203,900 | $222,200 |
| 2016 | $10,074 | $417,300 | $193,900 | $223,400 |
| 2015 | $9,891 | $414,900 | $188,900 | $226,000 |
| 2014 | $9,245 | $396,100 | $168,900 | $227,200 |
Source: Public Records
Map
Nearby Homes
- 19 Wesley Rd
- 498 Auten Rd Unit 4D
- 500 Auten Rd
- 277 Gemini Dr Unit 3B
- 277 Gemini Dr Unit 2D
- 507 Windsor Ct
- 52 Fisher Dr
- 4822 Bloomingdale Dr
- 300 Gemini Dr Unit 1C
- 3023 Revere Ct
- 3001 Revere Ct Unit 30011
- 4323 Bloomingdale Dr Unit 23
- 59 Taurus Dr Unit 1A
- 3631 Bloomingdale Dr Unit 31
- 4133 Bloomingdale Dr
- 3012 Cromwell Ct
- 3013 Cromwell Ct Unit 3013
- 3934 Bloomingdale Dr Unit 4
- 53 Taurus Dr Unit 4C
- 51 Taurus Dr Unit 4C