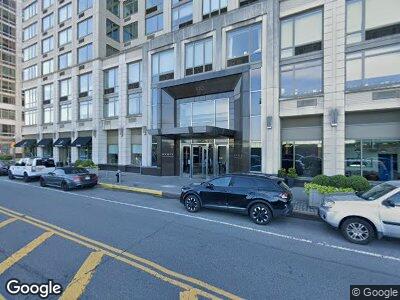
The Avery Condominium 100 Riverside Blvd Unit 11P New York, NY 10069
Lincoln Square NeighborhoodEstimated Value: $1,400,000 - $1,688,000
2
Beds
2
Baths
1,080
Sq Ft
$1,433/Sq Ft
Est. Value
About This Home
This home is located at 100 Riverside Blvd Unit 11P, New York, NY 10069 and is currently estimated at $1,548,089, approximately $1,433 per square foot. 100 Riverside Blvd Unit 11P is a home located in New York County with nearby schools including P.S./I.S. 191 - The Riverside School for Makers and Artists, Manhattan Day School, and West End Day School.
Ownership History
Date
Name
Owned For
Owner Type
Purchase Details
Closed on
Dec 28, 2023
Sold by
Chen Quan and Ma Ming
Bought by
Chen Quan
Current Estimated Value
Purchase Details
Closed on
Oct 11, 2016
Sold by
Chen Quan
Bought by
Chen Quan and Ma Ming
Purchase Details
Closed on
Apr 15, 2016
Sold by
Li Jiaming
Bought by
Chen Quan
Purchase Details
Closed on
Oct 30, 2013
Sold by
Kaufmann Julian D and Kaufmann Susan M
Bought by
Li Jiaming
Purchase Details
Closed on
Apr 24, 2008
Sold by
Crp/Extell Parcel H L P and % Extell Development
Bought by
Kaufmann Julian D and Kaufmann Susan M
Home Financials for this Owner
Home Financials are based on the most recent Mortgage that was taken out on this home.
Original Mortgage
$1,000,000
Interest Rate
5.93%
Mortgage Type
Purchase Money Mortgage
Create a Home Valuation Report for This Property
The Home Valuation Report is an in-depth analysis detailing your home's value as well as a comparison with similar homes in the area
Home Values in the Area
Average Home Value in this Area
Purchase History
| Date | Buyer | Sale Price | Title Company |
|---|---|---|---|
| Chen Quan | -- | -- | |
| Chen Quan | -- | -- | |
| Chen Quan | $1,670,000 | -- | |
| Li Jiaming | $1,575,000 | -- | |
| Kaufmann Julian D | $1,501,919 | -- |
Source: Public Records
Mortgage History
| Date | Status | Borrower | Loan Amount |
|---|---|---|---|
| Open | Chen Quan | $862,500 | |
| Previous Owner | Kaufmann Julian D | $1,000,000 |
Source: Public Records
Tax History Compared to Growth
Tax History
| Year | Tax Paid | Tax Assessment Tax Assessment Total Assessment is a certain percentage of the fair market value that is determined by local assessors to be the total taxable value of land and additions on the property. | Land | Improvement |
|---|---|---|---|---|
| 2024 | $27,661 | $221,256 | $11,406 | $209,850 |
| 2023 | $23,371 | $230,937 | $11,406 | $219,531 |
| 2022 | $26,851 | $247,432 | $11,406 | $236,026 |
| 2021 | $25,460 | $211,012 | $11,406 | $199,606 |
| 2020 | $21,042 | $234,429 | $11,406 | $223,023 |
| 2019 | $24,283 | $224,865 | $11,406 | $213,459 |
| 2018 | $18,713 | $221,432 | $11,406 | $210,026 |
| 2017 | $18,153 | $220,144 | $11,407 | $208,737 |
| 2016 | $12,882 | $188,135 | $11,406 | $176,729 |
| 2015 | $3,389 | $165,945 | $11,406 | $154,539 |
| 2014 | $3,389 | $162,938 | $11,406 | $151,532 |
Source: Public Records
About The Avery Condominium
Map
Nearby Homes
- 80 Riverside Blvd Unit 8E
- 80 Riverside Blvd Unit 16P
- 80 Riverside Blvd Unit 5-S
- 80 Riverside Blvd Unit 12A
- 80 Riverside Blvd Unit 1
- 80 Riverside Blvd Unit 7-A
- 80 Riverside Blvd
- 80 Riverside Blvd Unit 15-K
- 80 Riverside Blvd Unit 4X
- 80 Riverside Blvd Unit 6-BL
- 80 Riverside Blvd Unit 38CD
- 80 Riverside Blvd Unit 6-D
- 80 Riverside Blvd Unit 15B
- 80 Riverside Blvd Unit 6C
- 80 Riverside Blvd Unit 11N
- 80 Riverside Blvd Unit 4-XY
- 100 Riverside Blvd Unit 20H
- 100 Riverside Blvd Unit 23D
- 100 Riverside Blvd Unit 14D
- 100 Riverside Blvd Unit 11T