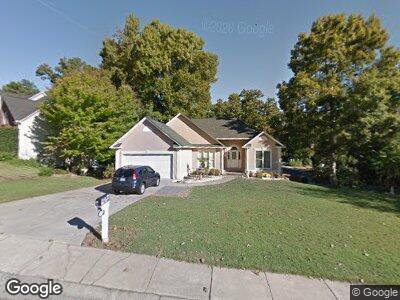
100 Widgeon Dr Lexington, SC 29072
Estimated Value: $389,000 - $404,000
6
Beds
3
Baths
3,184
Sq Ft
$125/Sq Ft
Est. Value
About This Home
This home is located at 100 Widgeon Dr, Lexington, SC 29072 and is currently estimated at $398,902, approximately $125 per square foot. 100 Widgeon Dr is a home located in Lexington County with nearby schools including Lexington Elementary School, River Bluff High School, and American Leadership Academy South Carolina-Lexington Campus.
Ownership History
Date
Name
Owned For
Owner Type
Purchase Details
Closed on
Dec 5, 2024
Sold by
Knight Valerie C and Montgomery Natalie K
Bought by
Wallace Joseph W and Pastovenska Yuliya A
Current Estimated Value
Home Financials for this Owner
Home Financials are based on the most recent Mortgage that was taken out on this home.
Original Mortgage
$319,200
Outstanding Balance
$319,200
Interest Rate
6.54%
Mortgage Type
New Conventional
Estimated Equity
$47,699
Purchase Details
Closed on
Sep 20, 2023
Sold by
Knight Kenneth E
Bought by
Montgomery Natalie K
Purchase Details
Closed on
Apr 7, 2023
Sold by
Knight Patricia
Bought by
Knight Patricia and Knight Valerie C
Purchase Details
Closed on
Jan 25, 2023
Sold by
Knight Patricia
Bought by
Valerie Knight C and Knight Valerie C
Create a Home Valuation Report for This Property
The Home Valuation Report is an in-depth analysis detailing your home's value as well as a comparison with similar homes in the area
Home Values in the Area
Average Home Value in this Area
Purchase History
| Date | Buyer | Sale Price | Title Company |
|---|---|---|---|
| Wallace Joseph W | $399,000 | None Listed On Document | |
| Montgomery Natalie K | $124,900 | None Listed On Document | |
| Knight Patricia | -- | None Listed On Document | |
| Valerie Knight C | -- | None Listed On Document |
Source: Public Records
Mortgage History
| Date | Status | Borrower | Loan Amount |
|---|---|---|---|
| Open | Wallace Joseph W | $319,200 | |
| Previous Owner | Knight Kenneth E | $145,909 | |
| Previous Owner | Knight Kenneth E | $157,000 |
Source: Public Records
Tax History Compared to Growth
Tax History
| Year | Tax Paid | Tax Assessment Tax Assessment Total Assessment is a certain percentage of the fair market value that is determined by local assessors to be the total taxable value of land and additions on the property. | Land | Improvement |
|---|---|---|---|---|
| 2024 | $1,423 | $8,106 | $1,600 | $6,506 |
| 2023 | $1,423 | $8,106 | $1,600 | $6,506 |
| 2022 | $954 | $8,106 | $1,600 | $6,506 |
| 2020 | $984 | $8,106 | $1,600 | $6,506 |
| 2019 | $899 | $7,310 | $1,200 | $6,110 |
| 2018 | $888 | $7,310 | $1,200 | $6,110 |
| 2017 | $842 | $7,223 | $1,200 | $6,023 |
| 2016 | $846 | $7,223 | $1,200 | $6,023 |
| 2014 | $835 | $7,316 | $1,200 | $6,116 |
| 2013 | -- | $7,320 | $1,200 | $6,120 |
Source: Public Records
Map
Nearby Homes
- 509 Mallard Lakes Dr
- 101 Deerglade Ct
- 1012 Corley St
- 111 Ashley Ct
- 108 Scotland Ct
- 133 Cheshire Rd
- 103 Huntington Cir
- 133 Stuart Ln
- 234 Clayborn Dr
- 132 Clayborn Dr
- 128 Clayborn Dr
- 251 Dreher St
- 225 Circleview Dr
- 309 Bryars Ct
- 204 Plantation Dr
- 110 Circleview Dr
- 156 Giaben Dr
- 301 Colony Hill Rd
- 105 Green Fern Ct
- 424 Forest Edge Trail