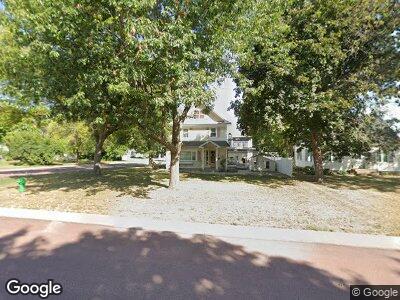
1003 1003 E 2nd St Blue Earth, MN 56013
Estimated Value: $224,000 - $266,000
4
Beds
3
Baths
3,500
Sq Ft
$68/Sq Ft
Est. Value
About This Home
This home is located at 1003 1003 E 2nd St, Blue Earth, MN 56013 and is currently estimated at $237,860, approximately $67 per square foot. 1003 1003 E 2nd St is a home located in Faribault County with nearby schools including Blue Earth Area High School.
Ownership History
Date
Name
Owned For
Owner Type
Purchase Details
Closed on
Nov 15, 2021
Sold by
Nagel Jeramy E and Nagel Renee L
Bought by
Johnson Daniel E
Current Estimated Value
Home Financials for this Owner
Home Financials are based on the most recent Mortgage that was taken out on this home.
Original Mortgage
$172,000
Outstanding Balance
$160,268
Interest Rate
3.01%
Mortgage Type
New Conventional
Estimated Equity
$76,442
Purchase Details
Closed on
Nov 25, 2005
Sold by
Wirtjes Randy T and Wirtjes Jody M
Bought by
Nagel Jeramy and Nagel Renee
Home Financials for this Owner
Home Financials are based on the most recent Mortgage that was taken out on this home.
Original Mortgage
$148,500
Interest Rate
6.2%
Mortgage Type
New Conventional
Create a Home Valuation Report for This Property
The Home Valuation Report is an in-depth analysis detailing your home's value as well as a comparison with similar homes in the area
Home Values in the Area
Average Home Value in this Area
Purchase History
| Date | Buyer | Sale Price | Title Company |
|---|---|---|---|
| Johnson Daniel E | $215,000 | Jenkinson Abstract | |
| Nagel Jeramy | $148,500 | None Available |
Source: Public Records
Mortgage History
| Date | Status | Borrower | Loan Amount |
|---|---|---|---|
| Open | Johnson Daniel E | $172,000 | |
| Previous Owner | Nagel Jeramy E | $146,200 | |
| Previous Owner | Nagel Jeramy E | $35,700 | |
| Previous Owner | Nagel Jeramy E | $29,800 | |
| Previous Owner | Nagle Jeramy E | $12,900 | |
| Previous Owner | Nagel Jeramy | $148,500 | |
| Previous Owner | Wirtjes Randy T | $124,000 |
Source: Public Records
Tax History Compared to Growth
Tax History
| Year | Tax Paid | Tax Assessment Tax Assessment Total Assessment is a certain percentage of the fair market value that is determined by local assessors to be the total taxable value of land and additions on the property. | Land | Improvement |
|---|---|---|---|---|
| 2024 | $4,274 | $240,400 | $12,500 | $227,900 |
| 2023 | $3,408 | $237,200 | $13,700 | $223,500 |
| 2022 | $3,266 | $165,300 | $13,700 | $151,600 |
| 2021 | $3,264 | $145,700 | $6,300 | $139,400 |
| 2020 | $1,756 | $139,600 | $6,300 | $133,300 |
| 2019 | $1,624 | $132,800 | $5,300 | $127,500 |
| 2018 | $2,038 | $126,100 | $3,600 | $122,500 |
| 2017 | $1,962 | $152,200 | $3,600 | $148,600 |
| 2015 | $1,774 | $152,200 | $3,600 | $148,600 |
| 2013 | -- | $152,200 | $3,600 | $148,600 |
Source: Public Records
Map
Nearby Homes
- 924 Upper Valley Dr
- 305 305 E 2nd St
- 305 E 2nd St
- 227 E 2nd St
- 314 N Moore St
- 220 S Ramsey St
- 608 N Main St
- 102 Prairie Rose Dr
- 106 Prairie Rose Dr
- 105 Bluestem Dr
- 109 Bluestem Dr
- 113 Bluestem Dr
- 110 Bluestem Dr
- 0 Xxx S Ramsey St
- 528 528 S Ramsey
- 421 S Moore St
- 212 S Linton St
- 226 S Linton St
- 11351 377th Ave
- xxx Faribault Dr