Estimated Value: $571,514 - $599,000
4
Beds
3
Baths
2,495
Sq Ft
$233/Sq Ft
Est. Value
About This Home
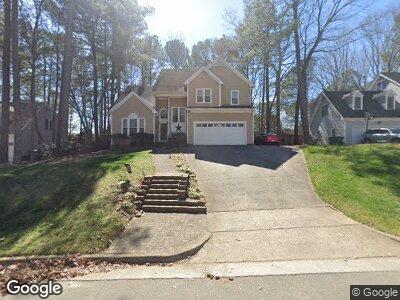
This home is located at 1005 W Abberley Ln, Apex, NC 27502 and is currently estimated at $580,879, approximately $232 per square foot. 1005 W Abberley Ln is a home located in Wake County with nearby schools including Penny Road Elementary School, Apex Middle, and Apex High School.
Ownership History
Date
Name
Owned For
Owner Type
Purchase Details
Closed on
Jun 25, 2013
Sold by
Hamm Carl M and Hamm Sylwia G
Bought by
Rose John Byron and Rose Sara Catherine
Current Estimated Value
Home Financials for this Owner
Home Financials are based on the most recent Mortgage that was taken out on this home.
Original Mortgage
$255,000
Interest Rate
3.53%
Mortgage Type
New Conventional
Purchase Details
Closed on
Dec 21, 2006
Sold by
Benbow Paul William and Copenhagen Elna Benbow
Bought by
Hamm Carl M and Hamm Sylwia G
Home Financials for this Owner
Home Financials are based on the most recent Mortgage that was taken out on this home.
Original Mortgage
$212,000
Interest Rate
6.31%
Mortgage Type
New Conventional
Create a Home Valuation Report for This Property
The Home Valuation Report is an in-depth analysis detailing your home's value as well as a comparison with similar homes in the area
Home Values in the Area
Average Home Value in this Area
Purchase History
| Date | Buyer | Sale Price | Title Company |
|---|---|---|---|
| Rose John Byron | $280,000 | None Available | |
| Hamm Carl M | $265,000 | None Available |
Source: Public Records
Mortgage History
| Date | Status | Borrower | Loan Amount |
|---|---|---|---|
| Open | Rose John Byron | $93,000 | |
| Open | Rose John Byron | $239,700 | |
| Closed | Rose John Byron | $255,000 | |
| Previous Owner | Hamm Carl M | $199,800 | |
| Previous Owner | Hamm Carl M | $42,600 | |
| Previous Owner | Hamm Carl M | $212,000 | |
| Previous Owner | Hamm Carl M | $39,750 | |
| Previous Owner | Benbow Paul W | $66,000 | |
| Previous Owner | Benbow Paul W | $163,000 | |
| Previous Owner | Benbow Paul William | $44,000 | |
| Previous Owner | Benbow Paul William | $168,000 | |
| Previous Owner | Benbow Paul William | $128,000 |
Source: Public Records
Tax History Compared to Growth
Tax History
| Year | Tax Paid | Tax Assessment Tax Assessment Total Assessment is a certain percentage of the fair market value that is determined by local assessors to be the total taxable value of land and additions on the property. | Land | Improvement |
|---|---|---|---|---|
| 2024 | $4,292 | $500,519 | $180,000 | $320,519 |
| 2023 | $3,632 | $329,271 | $80,000 | $249,271 |
| 2022 | $3,410 | $329,271 | $80,000 | $249,271 |
| 2021 | $3,280 | $329,271 | $80,000 | $249,271 |
| 2020 | $3,247 | $329,271 | $80,000 | $249,271 |
| 2019 | $3,084 | $269,815 | $75,000 | $194,815 |
| 2018 | $2,905 | $269,815 | $75,000 | $194,815 |
| 2017 | $2,705 | $269,815 | $75,000 | $194,815 |
| 2016 | $2,666 | $269,815 | $75,000 | $194,815 |
| 2015 | $2,626 | $259,478 | $64,000 | $195,478 |
| 2014 | $2,532 | $259,478 | $64,000 | $195,478 |
Source: Public Records
Map
Nearby Homes
- 2006 Chedington Dr
- 1809 Green Ford Ln
- 733 Hillsford Ln
- 317 Briarfield Dr
- 308 Hassellwood Dr
- 1007 Surry Dale Ct
- 125 Kelekent Ln
- 801 Myrtle Grove Ln
- 1005 Thorncroft Ln
- 219 Arbordale Ct
- 936 Regency Cottage Place
- 101 Hedwig Ct
- 3015 Old Raleigh Rd
- 1326 Apache Ln
- 3007 Old Raleigh Rd
- 121 Highclere Ln
- 1002 Springmill Ct
- 1704 Chestnut St
- 628 Briarcliff St
- 131 140 15 MacGregor Pines Dr