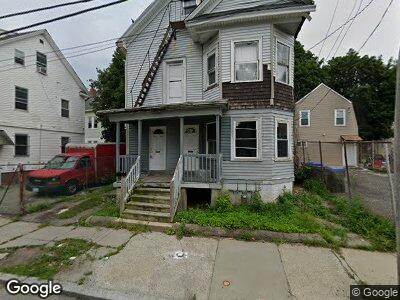
101 Baxter St Unit 103 Providence, RI 02905
Lower South Providence NeighborhoodEstimated Value: $345,070 - $534,000
5
Beds
3
Baths
1,985
Sq Ft
$226/Sq Ft
Est. Value
About This Home
This home is located at 101 Baxter St Unit 103, Providence, RI 02905 and is currently estimated at $449,518, approximately $226 per square foot. 101 Baxter St Unit 103 is a home located in Providence County with nearby schools including Asa Messer Elementary School, Charles N. Fortes Elementary School, and Robert L. Bailey IV Elementary.
Ownership History
Date
Name
Owned For
Owner Type
Purchase Details
Closed on
Feb 23, 2022
Sold by
Arline Mary A
Bought by
Tham Siho and Tjin Lielie
Current Estimated Value
Purchase Details
Closed on
Dec 31, 1992
Sold by
Shawmut Mtg Co
Bought by
Arline Mary A
Home Financials for this Owner
Home Financials are based on the most recent Mortgage that was taken out on this home.
Original Mortgage
$29,700
Interest Rate
8.32%
Purchase Details
Closed on
Nov 18, 1988
Sold by
Robert Ralph
Bought by
Dente Gerald
Home Financials for this Owner
Home Financials are based on the most recent Mortgage that was taken out on this home.
Original Mortgage
$38,000
Interest Rate
10.28%
Create a Home Valuation Report for This Property
The Home Valuation Report is an in-depth analysis detailing your home's value as well as a comparison with similar homes in the area
Home Values in the Area
Average Home Value in this Area
Purchase History
| Date | Buyer | Sale Price | Title Company |
|---|---|---|---|
| Tham Siho | $50,000 | None Available | |
| Arline Mary A | $45,000 | -- | |
| Arline Mary A | $45,000 | -- | |
| Dente Gerald | $48,000 | -- | |
| Dente Gerald | $48,000 | -- |
Source: Public Records
Mortgage History
| Date | Status | Borrower | Loan Amount |
|---|---|---|---|
| Previous Owner | Dente Gerald | $29,700 | |
| Previous Owner | Dente Gerald | $38,000 |
Source: Public Records
Tax History Compared to Growth
Tax History
| Year | Tax Paid | Tax Assessment Tax Assessment Total Assessment is a certain percentage of the fair market value that is determined by local assessors to be the total taxable value of land and additions on the property. | Land | Improvement |
|---|---|---|---|---|
| 2024 | $4,536 | $247,200 | $74,900 | $172,300 |
| 2023 | $4,536 | $247,200 | $74,900 | $172,300 |
| 2022 | $4,400 | $247,200 | $74,900 | $172,300 |
| 2021 | $2,525 | $102,800 | $33,000 | $69,800 |
| 2020 | $2,525 | $102,800 | $33,000 | $69,800 |
| 2019 | $2,525 | $102,800 | $33,000 | $69,800 |
| 2018 | $2,394 | $74,900 | $30,000 | $44,900 |
| 2017 | $2,394 | $74,900 | $30,000 | $44,900 |
| 2016 | $2,394 | $74,900 | $30,000 | $44,900 |
| 2015 | $2,224 | $67,200 | $30,000 | $37,200 |
| 2014 | $2,268 | $67,200 | $30,000 | $37,200 |
| 2013 | $2,268 | $67,200 | $30,000 | $37,200 |
Source: Public Records
Map
Nearby Homes