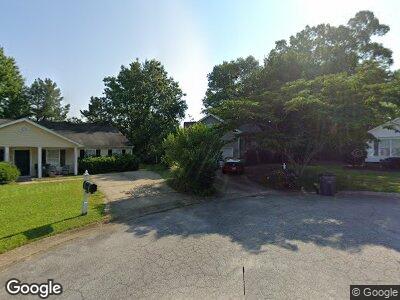
101 Braxberry Way Holly Springs, NC 27540
Estimated Value: $345,000 - $382,000
3
Beds
2
Baths
1,300
Sq Ft
$278/Sq Ft
Est. Value
About This Home
This home is located at 101 Braxberry Way, Holly Springs, NC 27540 and is currently estimated at $361,814, approximately $278 per square foot. 101 Braxberry Way is a home located in Wake County with nearby schools including Holly Grove Elementary School, Holly Grove Middle School, and Holly Springs High School.
Ownership History
Date
Name
Owned For
Owner Type
Purchase Details
Closed on
Dec 11, 2009
Sold by
Newman Judith A and Newman Jeffery T
Bought by
Lawson Glen Ian Edwin
Current Estimated Value
Home Financials for this Owner
Home Financials are based on the most recent Mortgage that was taken out on this home.
Original Mortgage
$163,265
Outstanding Balance
$110,053
Interest Rate
5.01%
Mortgage Type
New Conventional
Estimated Equity
$248,143
Purchase Details
Closed on
Jun 15, 2009
Sold by
Wagner Todd A
Bought by
Newman Judith A and Hoffman Denise
Purchase Details
Closed on
Mar 14, 2003
Sold by
Hoban Janis Lynn
Bought by
Wagner Todd A
Home Financials for this Owner
Home Financials are based on the most recent Mortgage that was taken out on this home.
Original Mortgage
$131,000
Interest Rate
11.02%
Purchase Details
Closed on
Apr 23, 1999
Sold by
Hlm Builder Group Inc
Bought by
Hoban Janis Lynn
Home Financials for this Owner
Home Financials are based on the most recent Mortgage that was taken out on this home.
Original Mortgage
$106,100
Interest Rate
5.25%
Create a Home Valuation Report for This Property
The Home Valuation Report is an in-depth analysis detailing your home's value as well as a comparison with similar homes in the area
Home Values in the Area
Average Home Value in this Area
Purchase History
| Date | Buyer | Sale Price | Title Company |
|---|---|---|---|
| Lawson Glen Ian Edwin | $160,000 | None Available | |
| Newman Judith A | $113,077 | None Available | |
| Wagner Todd A | $131,000 | -- | |
| Hoban Janis Lynn | $125,000 | -- |
Source: Public Records
Mortgage History
| Date | Status | Borrower | Loan Amount |
|---|---|---|---|
| Open | Lawson Glen Ian Edwin | $163,265 | |
| Previous Owner | Wagner Todd A | $131,000 | |
| Previous Owner | Hoban Janis Lynn | $106,100 |
Source: Public Records
Tax History Compared to Growth
Tax History
| Year | Tax Paid | Tax Assessment Tax Assessment Total Assessment is a certain percentage of the fair market value that is determined by local assessors to be the total taxable value of land and additions on the property. | Land | Improvement |
|---|---|---|---|---|
| 2024 | $2,762 | $319,939 | $110,000 | $209,939 |
| 2023 | $2,339 | $214,977 | $55,000 | $159,977 |
| 2022 | $2,258 | $214,977 | $55,000 | $159,977 |
| 2021 | $2,216 | $214,977 | $55,000 | $159,977 |
| 2020 | $2,216 | $214,977 | $55,000 | $159,977 |
| 2019 | $2,048 | $168,525 | $48,000 | $120,525 |
| 2018 | $1,852 | $168,525 | $48,000 | $120,525 |
| 2017 | $1,785 | $168,525 | $48,000 | $120,525 |
| 2016 | $1,761 | $168,525 | $48,000 | $120,525 |
| 2015 | $1,666 | $156,843 | $42,000 | $114,843 |
| 2014 | $1,609 | $156,843 | $42,000 | $114,843 |
Source: Public Records
Map
Nearby Homes
- 108 Braxberry Way
- 212 Blue Granite Dr
- 1712 Avent Ferry Rd
- 117 Talley Ridge Dr
- 420 Cahors Trail
- 101 Pointe Park Cir
- 104 Pointe Park Cir
- 108 Pointe Park Cir
- 112 Pointe Park Cir
- 116 Pointe Park Cir
- 116 Mystic Quartz Ln
- 901 Hollymont Dr
- 105 Mystic Quartz Ln
- 233 Pointe Park Cir
- 109 Magma Ln
- 112 Carolina Town Ln
- 613 Holly Thorn Trace
- 316 Sycamore Creek Dr
- 404 Braxman Ln
- 205 Braxcarr St