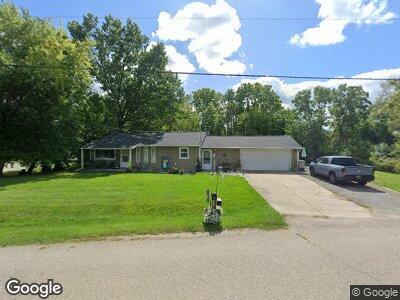
101 Diversy Dr Brooklyn, MI 49230
Estimated Value: $188,549 - $275,000
--
Bed
--
Bath
1,328
Sq Ft
$179/Sq Ft
Est. Value
About This Home
This home is located at 101 Diversy Dr, Brooklyn, MI 49230 and is currently estimated at $237,887, approximately $179 per square foot. 101 Diversy Dr is a home located in Jackson County with nearby schools including Columbia Elementary School, Columbia Upper Elementary School, and Columbia Central High School.
Ownership History
Date
Name
Owned For
Owner Type
Purchase Details
Closed on
Jul 3, 2003
Sold by
Cook Kevin J
Bought by
Cook Kevin J and Cook Michelle M
Current Estimated Value
Home Financials for this Owner
Home Financials are based on the most recent Mortgage that was taken out on this home.
Original Mortgage
$125,000
Outstanding Balance
$55,567
Interest Rate
5.3%
Mortgage Type
Purchase Money Mortgage
Estimated Equity
$182,320
Purchase Details
Closed on
Aug 1, 1992
Bought by
Cook
Create a Home Valuation Report for This Property
The Home Valuation Report is an in-depth analysis detailing your home's value as well as a comparison with similar homes in the area
Home Values in the Area
Average Home Value in this Area
Purchase History
| Date | Buyer | Sale Price | Title Company |
|---|---|---|---|
| Cook Kevin J | -- | -- | |
| Cook | $68,000 | -- |
Source: Public Records
Mortgage History
| Date | Status | Borrower | Loan Amount |
|---|---|---|---|
| Open | Cook Kevin J | $125,000 |
Source: Public Records
Tax History Compared to Growth
Tax History
| Year | Tax Paid | Tax Assessment Tax Assessment Total Assessment is a certain percentage of the fair market value that is determined by local assessors to be the total taxable value of land and additions on the property. | Land | Improvement |
|---|---|---|---|---|
| 2024 | $1,057 | $80,100 | $0 | $0 |
| 2023 | $1,007 | $73,200 | $0 | $0 |
| 2022 | $1,918 | $69,100 | $0 | $0 |
| 2021 | $1,916 | $66,200 | $0 | $0 |
| 2020 | $1,916 | $66,200 | $0 | $0 |
| 2019 | $1,897 | $55,800 | $0 | $0 |
| 2018 | $1,881 | $51,500 | $0 | $0 |
| 2017 | $1,827 | $50,200 | $0 | $0 |
| 2016 | $873 | $49,800 | $49,800 | $0 |
| 2015 | $1,816 | $46,100 | $46,100 | $0 |
| 2014 | $1,816 | $43,800 | $0 | $0 |
| 2013 | -- | $43,800 | $43,800 | $0 |
Source: Public Records
Map
Nearby Homes
- 11494 Hewitt Rd
- 0000 Hewitt Rd
- 10737 Hewitt Rd
- 10739 Hewitt Rd
- 11474 Hewitt Rd
- 223 Ambler Dr
- 00 Ambler Dr
- 207 Ambler Dr
- 133 Bingham Dr
- 105 Bingham Dr
- 203 Kirkley Dr
- 121 Ambler Dr
- 216 Nottingham Dr
- 99 Nottingham Dr
- 147 Castlewood Dr
- 227 Riviera Dr
- 10640 Hewitt Rd
- 103 Cannes Dr
- 6416 Kelley Rd
- 136 Fletcher Dr